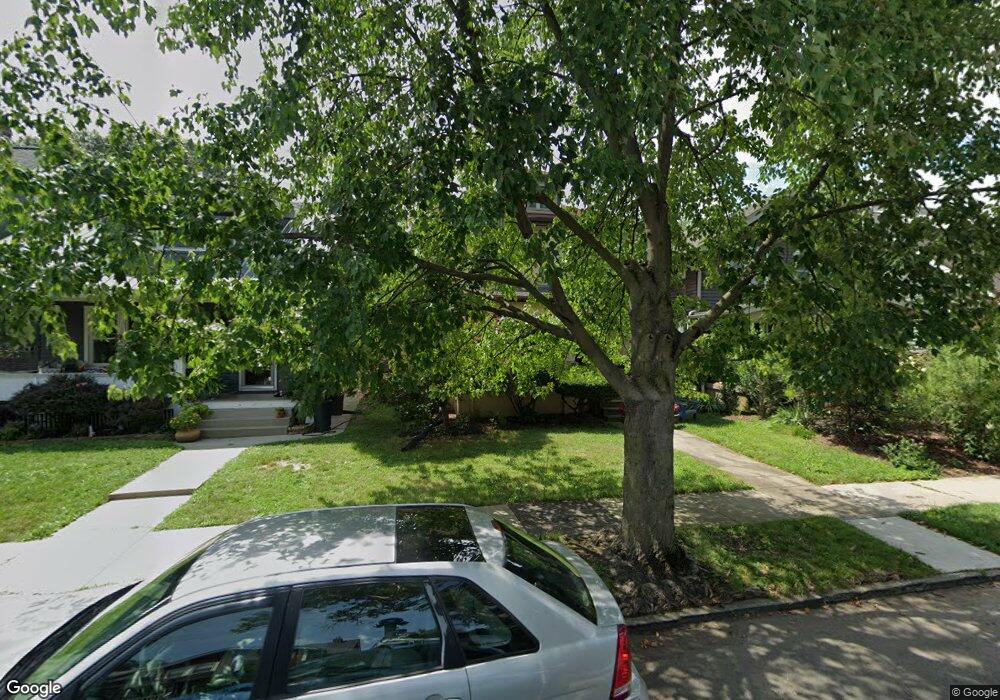
2607 Summit St Columbus, OH 43202
Old North Columbus NeighborhoodEstimated Value: $280,000 - $382,000
3
Beds
1
Bath
1,324
Sq Ft
$241/Sq Ft
Est. Value
About This Home
This home is located at 2607 Summit St, Columbus, OH 43202 and is currently estimated at $318,658, approximately $240 per square foot. 2607 Summit St is a home located in Franklin County with nearby schools including Clinton Elementary School, Dominion Middle School, and Whetstone High School.
Ownership History
Date
Name
Owned For
Owner Type
Purchase Details
Closed on
Dec 22, 2023
Sold by
Gonzalez Tanya A
Bought by
Lycans Andrew
Current Estimated Value
Purchase Details
Closed on
Dec 7, 1999
Sold by
Campbell Laura E and Campbell Nathan C
Bought by
Lycans Andrew and Gonzalez Tanya A
Home Financials for this Owner
Home Financials are based on the most recent Mortgage that was taken out on this home.
Original Mortgage
$103,632
Interest Rate
8.02%
Mortgage Type
FHA
Purchase Details
Closed on
Aug 16, 1999
Sold by
Pfister Arthur C and Arthur C Pfister Revocable Tru
Bought by
Campbell Laura E and Campbell Nathan C
Purchase Details
Closed on
Mar 12, 1991
Bought by
Pfister Arthur C Trustee
Purchase Details
Closed on
Aug 1, 1985
Purchase Details
Closed on
Aug 1, 1979
Create a Home Valuation Report for This Property
The Home Valuation Report is an in-depth analysis detailing your home's value as well as a comparison with similar homes in the area
Home Values in the Area
Average Home Value in this Area
Purchase History
| Date | Buyer | Sale Price | Title Company |
|---|---|---|---|
| Lycans Andrew | $131,000 | None Listed On Document | |
| Lycans Andrew | $105,000 | Franklin Abstract | |
| Campbell Laura E | -- | Franklin Abstract | |
| Pfister Arthur C Trustee | -- | -- | |
| -- | $40,000 | -- | |
| -- | $32,900 | -- |
Source: Public Records
Mortgage History
| Date | Status | Borrower | Loan Amount |
|---|---|---|---|
| Previous Owner | Lycans Andrew | $103,632 |
Source: Public Records
Tax History Compared to Growth
Tax History
| Year | Tax Paid | Tax Assessment Tax Assessment Total Assessment is a certain percentage of the fair market value that is determined by local assessors to be the total taxable value of land and additions on the property. | Land | Improvement |
|---|---|---|---|---|
| 2024 | $4,138 | $92,200 | $35,880 | $56,320 |
| 2023 | $4,085 | $92,190 | $35,875 | $56,315 |
| 2022 | $3,537 | $68,190 | $20,270 | $47,920 |
| 2021 | $3,543 | $68,190 | $20,270 | $47,920 |
| 2020 | $3,548 | $68,190 | $20,270 | $47,920 |
| 2019 | $3,192 | $52,610 | $15,610 | $37,000 |
| 2018 | $2,963 | $52,610 | $15,610 | $37,000 |
| 2017 | $3,104 | $52,610 | $15,610 | $37,000 |
| 2016 | $3,019 | $45,570 | $15,400 | $30,170 |
| 2015 | $2,740 | $45,570 | $15,400 | $30,170 |
| 2014 | $2,747 | $45,570 | $15,400 | $30,170 |
| 2013 | $1,291 | $43,400 | $14,665 | $28,735 |
Source: Public Records
Map
Nearby Homes
- 415 Glen Echo Cir
- 2521 Glenmawr Ave
- 2526 Glenmawr Ave
- 363 E Hudson St Unit 365
- 2584 Deming Ave
- 2680 Deming Ave
- 360-364 E Tompkins St
- 374 Parkview Dr Unit D
- 2433 N 4th St Unit 435
- 525-527 E Tompkins St
- 2804 Indianola Ave
- 2828 Kensington Place W
- 2397 Glenmawr Ave Unit 399
- 2395 Summit St Unit 397
- 2836-2838 Indianola Ave Unit 2836
- 2537 Medary Ave Unit 539
- 580 Crestview Rd
- 2350 Indiana Ave
- 185 E Tompkins St
- 2725 Homecroft Dr
- 2609 Summit St
- 2599 Summit St
- 2595 Summit St
- 2615 Summit St
- 2591 Summit St
- 2625 Summit St
- 2612 Glen Echo Dr
- 2608 Glen Echo Dr
- 2587 Summit St
- 2604 Glen Echo Dr
- 2598 Glen Echo Dr
- 2577 Summit St Unit 579
- 2577-2579 Summit St
- 2606 Summit St
- 2610 Summit St
- 2596 Summit St
- 2594 Summit St
- 2592 Glen Echo Dr
- 2618 Summit St
- 2573 Summit St Unit 575