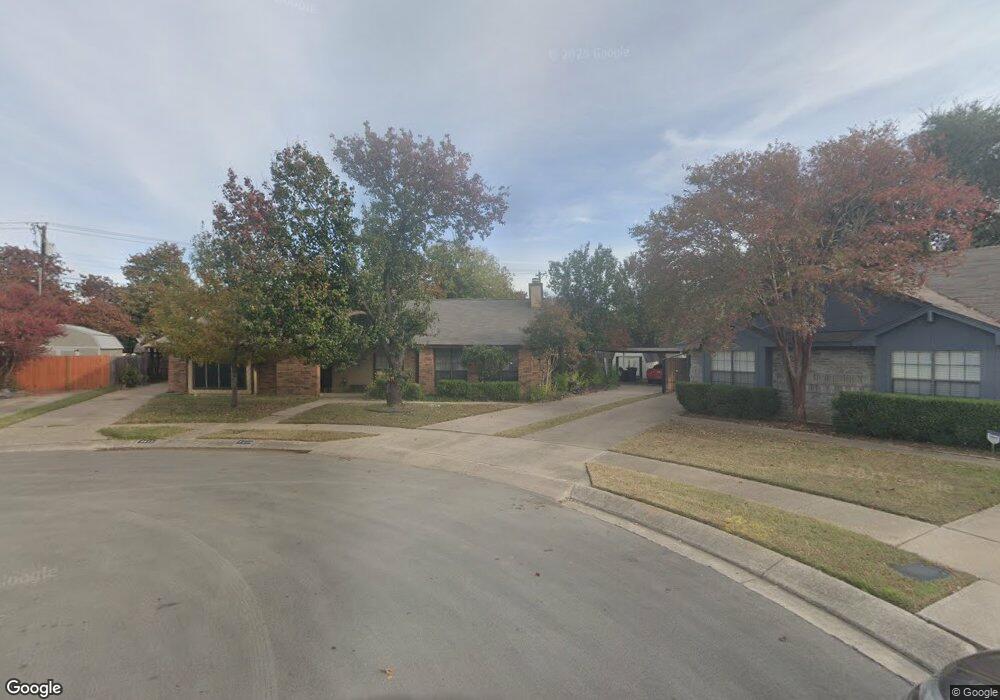
2608 Aquaduct Ct Bedford, TX 76022
Estimated Value: $252,987 - $280,000
2
Beds
1
Bath
1,070
Sq Ft
$248/Sq Ft
Est. Value
About This Home
This home is located at 2608 Aquaduct Ct, Bedford, TX 76022 and is currently estimated at $265,247, approximately $247 per square foot. 2608 Aquaduct Ct is a home located in Tarrant County with nearby schools including Wilshire Elementary School, Harwood Junior High School, and Trinity High School.
Ownership History
Date
Name
Owned For
Owner Type
Purchase Details
Closed on
Nov 12, 2018
Sold by
Southerland Dalwin V and Southerland Patricia R
Bought by
Harvey Sheryl Lynn and Clawson Lisa Ann
Current Estimated Value
Purchase Details
Closed on
Apr 22, 1997
Sold by
Patz Allison Beth
Bought by
Southerland Dalwin and Southerland Patricia R
Home Financials for this Owner
Home Financials are based on the most recent Mortgage that was taken out on this home.
Original Mortgage
$59,925
Interest Rate
11.37%
Purchase Details
Closed on
Aug 3, 1994
Sold by
Morgan Richelle Lynn and Johnson Richelle Lynn Morgan
Bought by
Patz Allison Beth
Home Financials for this Owner
Home Financials are based on the most recent Mortgage that was taken out on this home.
Original Mortgage
$64,417
Interest Rate
8.51%
Mortgage Type
FHA
Create a Home Valuation Report for This Property
The Home Valuation Report is an in-depth analysis detailing your home's value as well as a comparison with similar homes in the area
Home Values in the Area
Average Home Value in this Area
Purchase History
| Date | Buyer | Sale Price | Title Company |
|---|---|---|---|
| Harvey Sheryl Lynn | -- | None Available | |
| Southerland Dalwin | -- | Fidelity National Title | |
| Patz Allison Beth | -- | Safeco Land Title |
Source: Public Records
Mortgage History
| Date | Status | Borrower | Loan Amount |
|---|---|---|---|
| Previous Owner | Southerland Dalwin | $59,925 | |
| Previous Owner | Patz Allison Beth | $64,417 |
Source: Public Records
Tax History Compared to Growth
Tax History
| Year | Tax Paid | Tax Assessment Tax Assessment Total Assessment is a certain percentage of the fair market value that is determined by local assessors to be the total taxable value of land and additions on the property. | Land | Improvement |
|---|---|---|---|---|
| 2025 | $499 | $248,686 | $25,000 | $223,686 |
| 2024 | $499 | $248,686 | $25,000 | $223,686 |
| 2023 | $3,659 | $235,670 | $25,000 | $210,670 |
| 2022 | $3,788 | $216,435 | $25,000 | $191,435 |
| 2021 | $3,714 | $190,082 | $25,000 | $165,082 |
| 2020 | $3,408 | $161,007 | $25,000 | $136,007 |
| 2019 | $3,166 | $146,000 | $25,000 | $121,000 |
| 2018 | $858 | $118,459 | $25,000 | $93,459 |
| 2017 | $2,605 | $123,997 | $25,000 | $98,997 |
| 2016 | $2,368 | $105,138 | $25,000 | $80,138 |
| 2015 | $928 | $89,000 | $11,000 | $78,000 |
| 2014 | $928 | $89,000 | $11,000 | $78,000 |
Source: Public Records
Map
Nearby Homes
- 2428 Chestnut Way
- 2420 Dalewood Ln
- 2504 Westpark Way Cir
- 1116 Highpoint Rd
- 1049 Stableway Ln
- 2421 Creek Villas Dr
- 2303 Mcmullin Dr
- 2620 Britany Cir
- 1213 Greendale Dr
- 2150 Eva Ln
- 828 Gregory Ave
- 800 Prestwick St
- 808 Gregory Ave
- 2101 Gettysburg Place
- 2201 Greendale Ct
- 2024 Charleston Dr
- 2025 Schumac Ln
- 1216 Princeton Place
- 1911 Long Bow Trail
- 1914 Kynette Dr
- 2612 Aquaduct Ct
- 2604 Aquaduct Ct
- 2609 Dalewood Ct
- 2613 Dalewood Ct
- 2600 Aquaduct Ct
- 2422 Westpark Way Cir
- 2613 Aquaduct Ct
- 2420 Westpark Way Cir
- 2605 Dalewood Ct
- 2529 Westpark Way Cir
- 2601 Dalewood Ct
- 2601 Dalewood Ct
- 2609 Aquaduct Ct
- 2418 Westpark Way Cir
- 2605 Aquaduct Ct
- 2527 Westpark Way Cir
- 2601 Aquaduct Ct
- 2436 Aquaduct Dr
- 2437 Dalewood Ln
- 2416 Westpark Way Cir