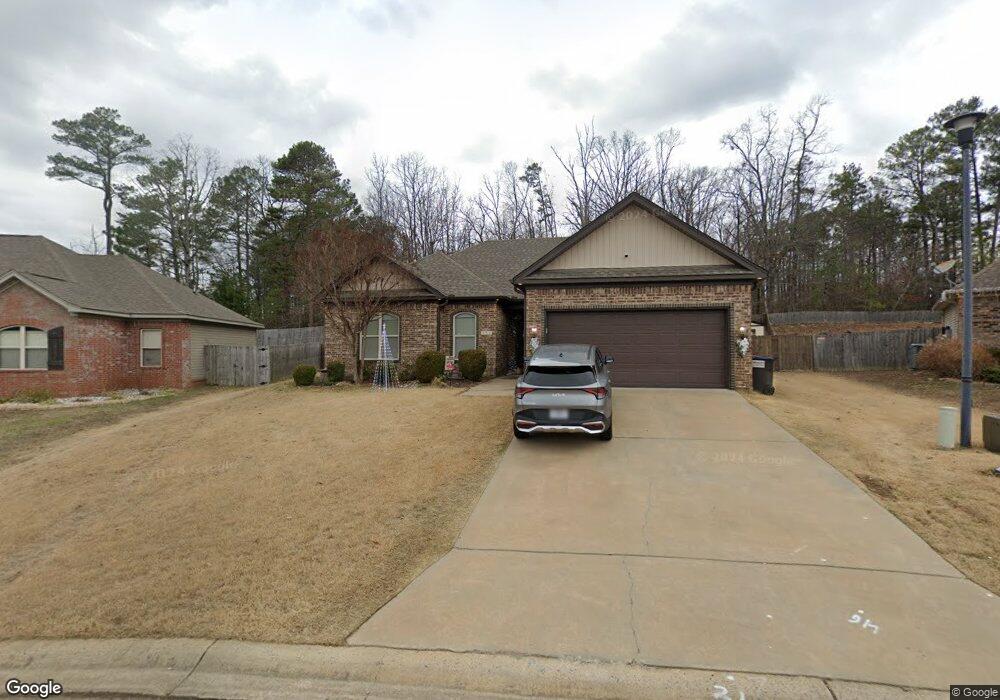
2608 Finley Loop Bryant, AR 72022
Estimated Value: $231,000 - $240,000
Studio
2
Baths
1,491
Sq Ft
$158/Sq Ft
Est. Value
About This Home
This home is located at 2608 Finley Loop, Bryant, AR 72022 and is currently estimated at $235,507, approximately $157 per square foot. 2608 Finley Loop is a home located in Saline County with nearby schools including Springhill Elementary School and Arkansas Christian Academy.
Ownership History
Date
Name
Owned For
Owner Type
Purchase Details
Closed on
Aug 8, 2017
Sold by
Wells Justin J
Bought by
Bullock Cody B and Bullock Terry Daniel
Current Estimated Value
Home Financials for this Owner
Home Financials are based on the most recent Mortgage that was taken out on this home.
Original Mortgage
$157,003
Outstanding Balance
$130,723
Interest Rate
3.88%
Mortgage Type
FHA
Estimated Equity
$104,784
Purchase Details
Closed on
Aug 9, 2011
Sold by
Keel Custom Homes
Bought by
Wells Justin J
Home Financials for this Owner
Home Financials are based on the most recent Mortgage that was taken out on this home.
Original Mortgage
$147,150
Interest Rate
4.53%
Mortgage Type
New Conventional
Purchase Details
Closed on
Dec 27, 2010
Sold by
Hwh Land Development Llc
Bought by
Keel Custom Homes Limited Co
Home Financials for this Owner
Home Financials are based on the most recent Mortgage that was taken out on this home.
Original Mortgage
$115,200
Interest Rate
4.36%
Mortgage Type
Construction
Create a Home Valuation Report for This Property
The Home Valuation Report is an in-depth analysis detailing your home's value as well as a comparison with similar homes in the area
Home Values in the Area
Average Home Value in this Area
Purchase History
| Date | Buyer | Sale Price | Title Company |
|---|---|---|---|
| Bullock Cody B | $159,900 | None Available | |
| Wells Justin J | $150,000 | Lenders Title Co | |
| Keel Custom Homes Limited Co | $25,000 | -- |
Source: Public Records
Mortgage History
| Date | Status | Borrower | Loan Amount |
|---|---|---|---|
| Open | Bullock Cody B | $157,003 | |
| Previous Owner | Wells Justin J | $147,150 | |
| Previous Owner | Keel Custom Homes Limited Co | $115,200 |
Source: Public Records
Tax History
| Year | Tax Paid | Tax Assessment Tax Assessment Total Assessment is a certain percentage of the fair market value that is determined by local assessors to be the total taxable value of land and additions on the property. | Land | Improvement |
|---|---|---|---|---|
| 2025 | $1,924 | $37,643 | $7,280 | $30,363 |
| 2024 | $1,755 | $37,643 | $7,280 | $30,363 |
| 2023 | $1,954 | $37,643 | $7,280 | $30,363 |
| 2022 | $1,878 | $37,643 | $7,280 | $30,363 |
| 2021 | $1,803 | $31,290 | $5,600 | $25,690 |
| 2020 | $1,803 | $31,290 | $5,600 | $25,690 |
| 2019 | $1,803 | $31,290 | $5,600 | $25,690 |
| 2018 | $1,828 | $31,290 | $5,600 | $25,690 |
| 2017 | $1,803 | $31,290 | $5,600 | $25,690 |
| 2016 | $1,432 | $29,350 | $5,000 | $24,350 |
| 2015 | $1,432 | $29,350 | $5,000 | $24,350 |
| 2014 | $1,620 | $29,350 | $5,000 | $24,350 |
Source: Public Records
Map
Nearby Homes
- 2705 Finley Loop
- 2502 Daisy Cove
- 4600 Hilldale Rd
- 6302 Rim Fire Cove
- 2405 Sam Tillery Dr
- 2413 Sam Tillery Dr
- 1219 War Eagle Dr
- 4060 Marshall Way
- 4054 Marshall Way
- 4036 Marshall Way
- 9040 Naples Cove
- 9017 Naples Cove
- 8036 N Shoreline Blvd
- 5709 Tumble Rock Ct
- 8028 N Shoreline Blvd
- 5184 Peace Ln
- 6899 Grace Village Dr
- 6898 Grace Village Dr
- 6902 Grace Village Dr
- 5168 Peace Ln
- 0 Finley Loop Unit 16010583
- 0 Finley Loop Unit 16027538
- 0 Finley Loop Unit 17002955
- 0 Finley Loop Unit 17007870
- 0 Finley Loop Unit 17016852
- 0 Finley Loop Unit 20027052
- 0 Finley Loop Unit 20030701
- 2606 Finley Loop
- 2604 Finley Loop
- 2612 Finley Loop
- 2613 Finley Loop
- 2614 Finley Loop
- 2602 Finley Loop
- 2605 Finley Loop
- 2502 Springhill Village Dr
- 2615 Finley Loop
- 2603 Finley Loop
- 2616 Finley Loop
- 2600 Finley Loop
- 2518 Springhill Village Dr
Your Personal Tour Guide
Ask me questions while you tour the home.