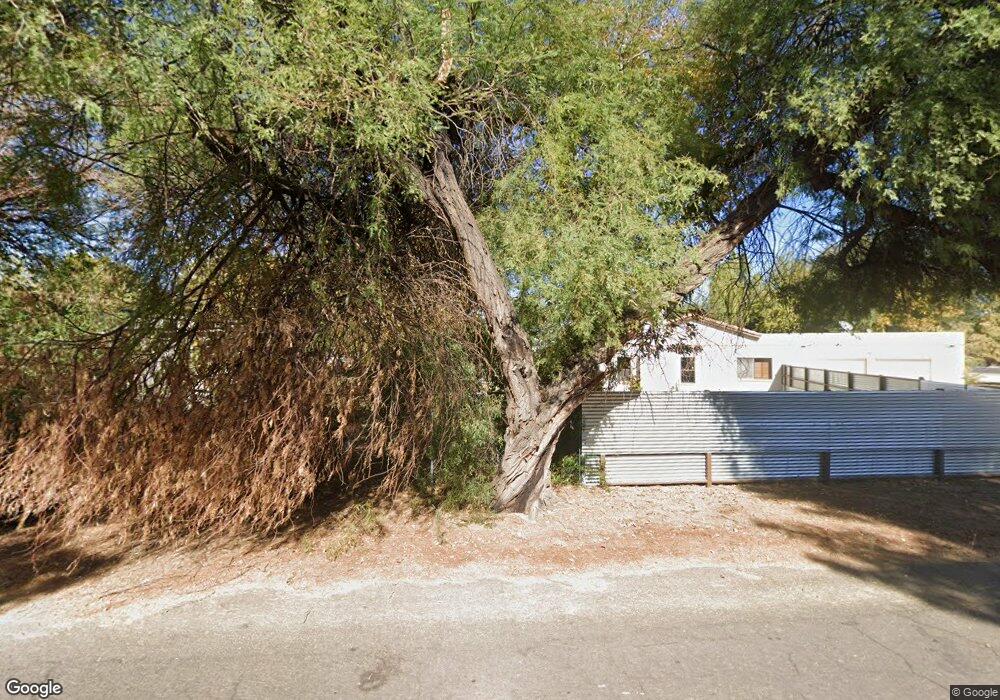
2608 N Dobson Rd Chandler, AZ 85224
Central Ridge NeighborhoodEstimated Value: $658,000 - $779,957
--
Bed
2
Baths
2,538
Sq Ft
$284/Sq Ft
Est. Value
About This Home
This home is located at 2608 N Dobson Rd, Chandler, AZ 85224 and is currently estimated at $721,989, approximately $284 per square foot. 2608 N Dobson Rd is a home located in Maricopa County with nearby schools including Pomeroy Elementary School, Franklin at Brimhall Elementary School, and Summit Academy Elementary.
Ownership History
Date
Name
Owned For
Owner Type
Purchase Details
Closed on
Jun 18, 2020
Sold by
Hook Stephanie Michelle and Estate Of Richard Keith Hook
Bought by
Hill Gary L and Hill Bonnie J
Current Estimated Value
Purchase Details
Closed on
Mar 2, 2009
Sold by
Hook Marvin W
Bought by
Hook Richard K
Purchase Details
Closed on
Jul 5, 2008
Sold by
Hook Gary
Bought by
Hook Richard K
Purchase Details
Closed on
Jun 24, 2008
Sold by
Hook Kenneth
Bought by
Hook Richard K
Purchase Details
Closed on
Apr 3, 2008
Sold by
Hook Michael N
Bought by
Hook Richard K
Purchase Details
Closed on
Aug 3, 2007
Sold by
Hook Marvin W and Hook Norma E
Bought by
Hook Marvin W and Hook Richard K
Purchase Details
Closed on
Dec 27, 2006
Sold by
Hook Norma E
Bought by
Hook Richard K and Hook Norma E
Create a Home Valuation Report for This Property
The Home Valuation Report is an in-depth analysis detailing your home's value as well as a comparison with similar homes in the area
Home Values in the Area
Average Home Value in this Area
Purchase History
| Date | Buyer | Sale Price | Title Company |
|---|---|---|---|
| Hill Gary L | $400,000 | Chicago Title Agency | |
| Hook Richard K | -- | None Available | |
| Hook Richard K | -- | None Available | |
| Hook Richard K | -- | None Available | |
| Hook Richard K | -- | None Available | |
| Hook Richard K | -- | None Available | |
| Hook Marvin W | -- | None Available | |
| Hook Richard K | -- | None Available |
Source: Public Records
Tax History Compared to Growth
Tax History
| Year | Tax Paid | Tax Assessment Tax Assessment Total Assessment is a certain percentage of the fair market value that is determined by local assessors to be the total taxable value of land and additions on the property. | Land | Improvement |
|---|---|---|---|---|
| 2025 | $4,771 | $50,321 | -- | -- |
| 2024 | $4,692 | $47,924 | -- | -- |
| 2023 | $4,692 | $60,620 | $12,120 | $48,500 |
| 2022 | $4,498 | $48,570 | $9,710 | $38,860 |
| 2021 | $5,093 | $45,010 | $9,000 | $36,010 |
| 2020 | $4,469 | $42,870 | $8,570 | $34,300 |
| 2019 | $4,105 | $37,550 | $7,510 | $30,040 |
| 2018 | $4,066 | $38,300 | $7,660 | $30,640 |
| 2017 | $3,909 | $39,420 | $7,880 | $31,540 |
| 2016 | $3,737 | $41,220 | $8,240 | $32,980 |
| 2015 | $3,514 | $35,870 | $7,170 | $28,700 |
Source: Public Records
Map
Nearby Homes
- 2029 W Shawnee Dr
- 2615 N Yucca St
- 1821 W Mission Dr
- 1807 W Mission Dr
- 1805 W Cheyenne Dr
- 2337 W Cheyenne Dr
- 2103 W Palomino Dr
- 2674 N El Dorado Dr
- 2210 N Los Altos Dr
- 2129 N Villas Ln
- 1511 W Mesquite St
- 1771 W Mariposa Ct
- 2015 N Villas Ln
- 2014 W Summit Place
- 1309 W Marlboro Dr
- 1800 W Rosewood Ct
- 2727 N Price Rd Unit 50
- 2727 N Price Rd Unit 57
- 2727 N Price Rd Unit 28
- 2431 W Los Arboles Place
- 2622 N Dobson Rd
- 2546 N Dobson Rd
- 2030 W Shawnee Dr
- 2536 N Dobson Rd
- 2040 W Shawnee Dr
- 2039 W Shawnee Dr
- 2604 N Yucca St
- 2029 W Cheyenne Dr
- 2606 N Yucca St
- 2602 N Yucca St
- 2526 N Dobson Rd
- 2608 N Yucca St
- 2600 N Yucca St
- 2105 W Shawnee Dr
- 2610 N Yucca St
- 2570 N Yucca Ct
- 2521 N Yucca Ct
- 2039 W Cheyenne Dr
- 2516 N Dobson Rd
- 1830 W Mission Dr