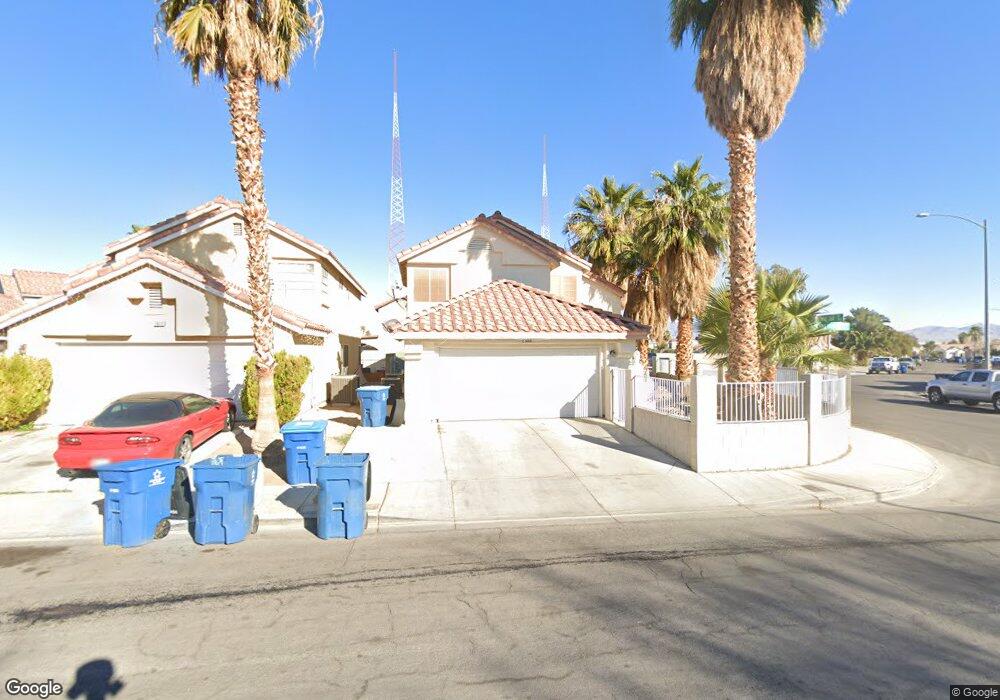
2608 Rising Legend Way Las Vegas, NV 89106
West Las Vegas NeighborhoodEstimated Value: $326,000 - $433,000
4
Beds
3
Baths
1,780
Sq Ft
$210/Sq Ft
Est. Value
About This Home
This home is located at 2608 Rising Legend Way, Las Vegas, NV 89106 and is currently estimated at $374,073, approximately $210 per square foot. 2608 Rising Legend Way is a home located in Clark County with nearby schools including Ollie Detwiler Elementary School, West Prepatory Academy At Charlles I West Hall Sec, and Western High School.
Ownership History
Date
Name
Owned For
Owner Type
Purchase Details
Closed on
Feb 10, 2012
Sold by
Rojas Sonia
Bought by
Sonia Rojas Living Trust
Current Estimated Value
Purchase Details
Closed on
May 19, 2005
Sold by
Melchor Lorena
Bought by
Rojas Sonia
Home Financials for this Owner
Home Financials are based on the most recent Mortgage that was taken out on this home.
Original Mortgage
$184,000
Interest Rate
5.87%
Mortgage Type
New Conventional
Purchase Details
Closed on
Feb 17, 2005
Sold by
Melchor Fidencio
Bought by
Melchor Lorena
Purchase Details
Closed on
Aug 2, 1995
Sold by
Rancho Classic Ltd Partnership
Bought by
Melchor Fidencio and Melchor Lorena
Home Financials for this Owner
Home Financials are based on the most recent Mortgage that was taken out on this home.
Original Mortgage
$113,599
Interest Rate
7.61%
Mortgage Type
FHA
Create a Home Valuation Report for This Property
The Home Valuation Report is an in-depth analysis detailing your home's value as well as a comparison with similar homes in the area
Home Values in the Area
Average Home Value in this Area
Purchase History
| Date | Buyer | Sale Price | Title Company |
|---|---|---|---|
| Sonia Rojas Living Trust | -- | None Available | |
| Rojas Sonia | $230,000 | Equity Title Of Nevada | |
| Melchor Lorena | -- | Equity Title Of Nevada | |
| Melchor Fidencio | $115,000 | United Title |
Source: Public Records
Mortgage History
| Date | Status | Borrower | Loan Amount |
|---|---|---|---|
| Previous Owner | Rojas Sonia | $184,000 | |
| Previous Owner | Melchor Fidencio | $113,599 | |
| Closed | Rojas Sonia | $46,000 |
Source: Public Records
Tax History Compared to Growth
Tax History
| Year | Tax Paid | Tax Assessment Tax Assessment Total Assessment is a certain percentage of the fair market value that is determined by local assessors to be the total taxable value of land and additions on the property. | Land | Improvement |
|---|---|---|---|---|
| 2025 | $1,183 | $76,945 | $24,500 | $52,445 |
| 2024 | $1,149 | $76,945 | $24,500 | $52,445 |
| 2023 | $937 | $72,400 | $22,400 | $50,000 |
| 2022 | $1,116 | $65,434 | $19,600 | $45,834 |
| 2021 | $1,083 | $63,348 | $19,600 | $43,748 |
| 2020 | $1,049 | $61,411 | $17,850 | $43,561 |
| 2019 | $1,018 | $55,898 | $12,950 | $42,948 |
| 2018 | $989 | $51,586 | $10,500 | $41,086 |
| 2017 | $1,641 | $50,043 | $8,400 | $41,643 |
| 2016 | $937 | $47,430 | $5,950 | $41,480 |
| 2015 | $934 | $32,639 | $4,200 | $28,439 |
| 2014 | $907 | $27,649 | $2,100 | $25,549 |
Source: Public Records
Map
Nearby Homes
- 2508 Ellingson Dr
- 1604 Luning Dr
- 1920 Hodgenville St Unit 103
- 2621 Adelante Ave Unit 104
- 2621 Adelante Ave Unit 102
- 1901 Manhattan Dr
- 2525 Sierra Bello Ave Unit 103
- 1956 Vista Malaga St Unit 103
- 2501 Charleville Ave Unit 104
- 1700 Ferrell St
- 3017 Holly Ave
- 2521 Sierra Luna Ave Unit 106
- 1204 Arrowhead Ave
- 2624 Feather Cactus Ct
- 2520 Bottle Palm Ct
- 2100 Port Ave
- 1106 Arrowhead Ave
- 1225 Arrowhead Ave
- 2045 Rose Coral Ave
- 3494 Alpheus River Ave
- 2612 Rising Legend Way
- 1801 Wild Jan Dr
- 2616 Rising Legend Way
- 2620 Rising Legend Way
- 1800 Wild Jan Dr
- 2700 Coffee Pot Ct
- 2609 Rising Legend Way
- 2613 Rising Legend Way
- 1805 Wild Jan Dr
- 2605 Rising Legend Way
- 2617 Rising Legend Way Unit 3
- 1804 Wild Jan Dr
- 2704 Coffee Pot Ct
- 2601 Rising Legend Way
- 2625 Rising Legend Way
- 1808 Wild Jan Dr
- 2628 Rising Legend Way
- 1813 Wild Jan Dr
- 2708 Coffee Pot Ct