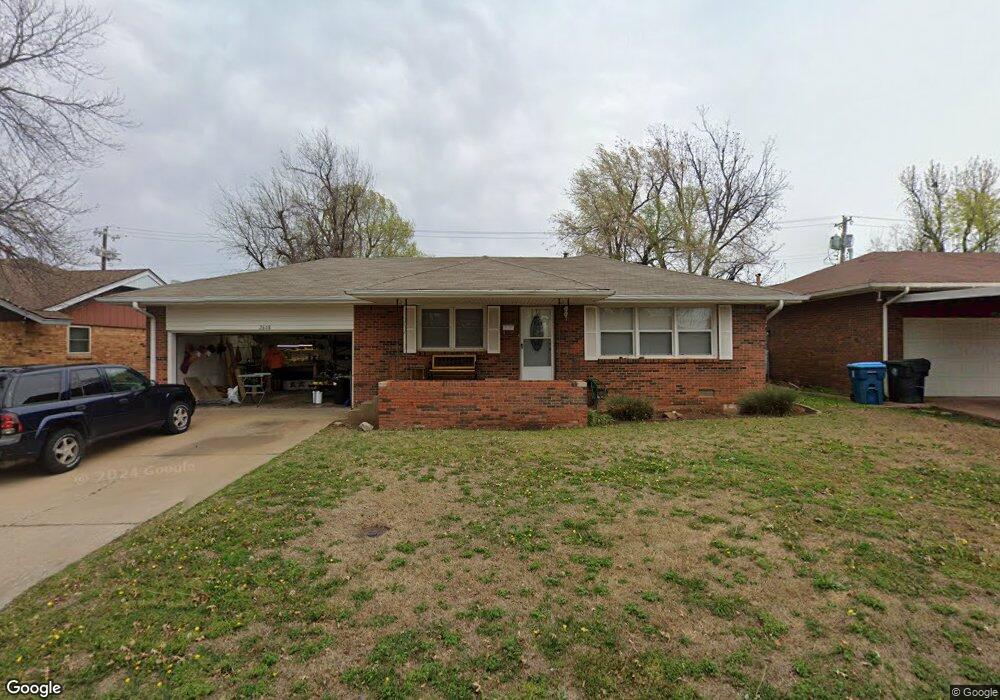
2608 Robin Rd Oklahoma City, OK 73110
Estimated Value: $150,409 - $173,000
3
Beds
2
Baths
1,305
Sq Ft
$123/Sq Ft
Est. Value
About This Home
This home is located at 2608 Robin Rd, Oklahoma City, OK 73110 and is currently estimated at $161,102, approximately $123 per square foot. 2608 Robin Rd is a home located in Oklahoma County with nearby schools including Country Estates Elementary School, Midwest City Middle School, and Midwest City High School.
Ownership History
Date
Name
Owned For
Owner Type
Purchase Details
Closed on
Mar 27, 2024
Sold by
Hoffman Arthur E and Hoffman Judith A
Bought by
Deatherage Brandon and Deatherage Shawn A
Current Estimated Value
Home Financials for this Owner
Home Financials are based on the most recent Mortgage that was taken out on this home.
Original Mortgage
$127,000
Outstanding Balance
$117,989
Interest Rate
4%
Mortgage Type
New Conventional
Estimated Equity
$43,113
Purchase Details
Closed on
Aug 9, 2005
Sold by
Hoffman Arthur E and Hoffman Judith A
Bought by
Hoffman Arthur E and Hoffman Judith A
Purchase Details
Closed on
Jul 11, 2003
Sold by
Moseley Tim
Bought by
Hoffman Arthur E and Hoffman Judith A
Purchase Details
Closed on
Sep 17, 1999
Sold by
Oconnell Nancy J
Bought by
Moseley Tim and Moseley Julie
Purchase Details
Closed on
Aug 31, 1998
Sold by
Cram Viki and Jackson Don
Bought by
Oconnell Nancy J
Create a Home Valuation Report for This Property
The Home Valuation Report is an in-depth analysis detailing your home's value as well as a comparison with similar homes in the area
Home Values in the Area
Average Home Value in this Area
Purchase History
| Date | Buyer | Sale Price | Title Company |
|---|---|---|---|
| Deatherage Brandon | $127,000 | None Listed On Document | |
| Hoffman Arthur E | -- | -- | |
| Hoffman Arthur E | $65,000 | Capitol Abstract & Title Co | |
| Moseley Tim | $67,500 | -- | |
| Oconnell Nancy J | $57,000 | -- |
Source: Public Records
Mortgage History
| Date | Status | Borrower | Loan Amount |
|---|---|---|---|
| Open | Deatherage Brandon | $127,000 |
Source: Public Records
Tax History Compared to Growth
Tax History
| Year | Tax Paid | Tax Assessment Tax Assessment Total Assessment is a certain percentage of the fair market value that is determined by local assessors to be the total taxable value of land and additions on the property. | Land | Improvement |
|---|---|---|---|---|
| 2024 | $1,334 | $11,899 | $2,254 | $9,645 |
| 2023 | $1,334 | $11,332 | $1,719 | $9,613 |
| 2022 | $1,259 | $10,792 | $1,816 | $8,976 |
| 2021 | $1,228 | $10,279 | $2,000 | $8,279 |
| 2020 | $1,202 | $9,790 | $2,119 | $7,671 |
| 2019 | $1,194 | $10,164 | $1,704 | $8,460 |
| 2018 | $1,067 | $9,680 | $0 | $0 |
| 2017 | $1,078 | $9,625 | $1,716 | $7,909 |
| 2016 | $1,082 | $9,405 | $1,716 | $7,689 |
| 2015 | $1,119 | $9,336 | $1,966 | $7,370 |
| 2014 | -- | $9,407 | $1,966 | $7,441 |
Source: Public Records
Map
Nearby Homes
- 2825 Woodcreek Rd
- 125 Gill Dr
- 125 W Coe Dr
- 305 W Coe Dr
- 216 W Coe Dr
- 216 Gill Dr
- 2921 Shadybrook Dr
- 209 W Glenhaven Dr
- 204 E Coe Dr
- 3016 Shadybrook Dr
- 201 E Key Blvd
- 133 W Steed Dr
- 104 E Ridgewood Dr
- 212 W Ridgewood Dr
- 2121 Stevens Dr
- 2109 Stevens Dr
- 112 W Silver Meadow Dr
- 104 W Silver Meadow Dr
- 208 S Fox Dr
- 3321 N Ridgewood Dr