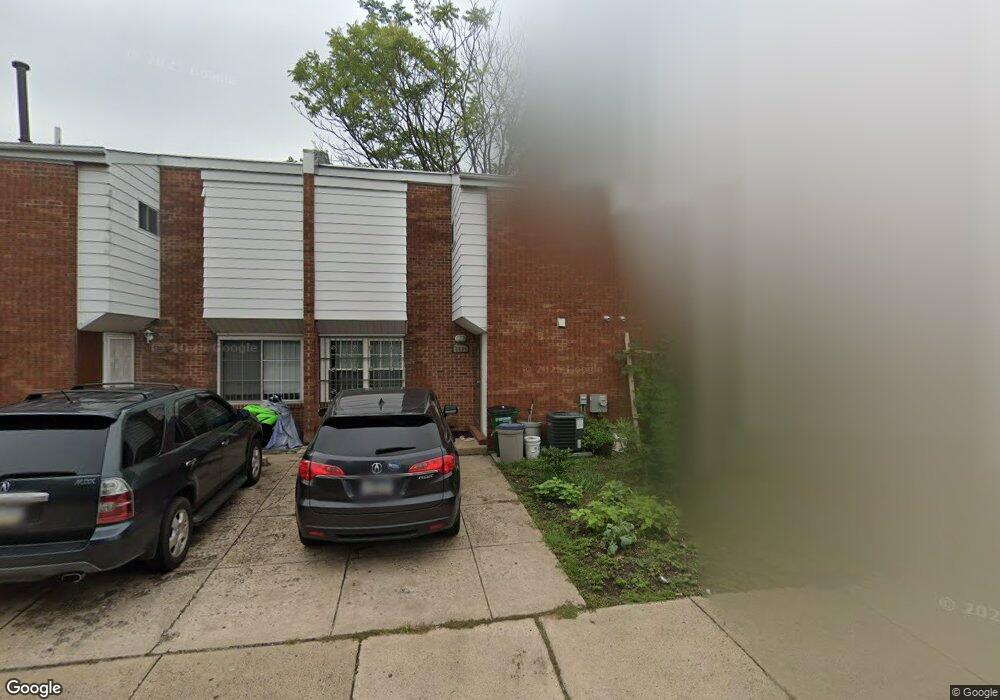
2608 S Hancock St Philadelphia, PA 19148
Whitman NeighborhoodEstimated Value: $300,000 - $423,316
3
Beds
1
Bath
1,750
Sq Ft
$193/Sq Ft
Est. Value
About This Home
This home is located at 2608 S Hancock St, Philadelphia, PA 19148 and is currently estimated at $337,079, approximately $192 per square foot. 2608 S Hancock St is a home located in Philadelphia County with nearby schools including John H. Taggart School, Furness Horace High School, and Mastery Charter Thomas Elementary School.
Ownership History
Date
Name
Owned For
Owner Type
Purchase Details
Closed on
Apr 25, 2014
Sold by
Blue Mountain Homes Llc
Bought by
Zheng Lina
Current Estimated Value
Purchase Details
Closed on
Mar 18, 2013
Sold by
Bank Of America N A
Bought by
Blue Mountian Homes Llc
Purchase Details
Closed on
Mar 9, 2009
Sold by
Mahallati Smith Mandonnah and Smith Christerfer
Bought by
Bank Of America Na
Purchase Details
Closed on
Mar 25, 2008
Sold by
Mahallati Smith Mandonnah
Bought by
Mahallati Joseph and Mahallati Smith Mandonnah
Purchase Details
Closed on
Mar 30, 2005
Sold by
The Philadelphia Housing Authority
Bought by
Mahallati Smith Mandonnah
Home Financials for this Owner
Home Financials are based on the most recent Mortgage that was taken out on this home.
Original Mortgage
$45,590
Interest Rate
5.83%
Mortgage Type
Fannie Mae Freddie Mac
Create a Home Valuation Report for This Property
The Home Valuation Report is an in-depth analysis detailing your home's value as well as a comparison with similar homes in the area
Home Values in the Area
Average Home Value in this Area
Purchase History
| Date | Buyer | Sale Price | Title Company |
|---|---|---|---|
| Zheng Lina | $128,625 | Chicago Title Insurance Co | |
| Blue Mountian Homes Llc | $73,500 | None Available | |
| Bank Of America Na | $6,400 | None Available | |
| Mahallati Joseph | -- | None Available | |
| Mahallati Smith Mandonnah | $47,000 | Fidelity Natl Title Ins Co |
Source: Public Records
Mortgage History
| Date | Status | Borrower | Loan Amount |
|---|---|---|---|
| Previous Owner | Mahallati Smith Mandonnah | $45,590 |
Source: Public Records
Tax History Compared to Growth
Tax History
| Year | Tax Paid | Tax Assessment Tax Assessment Total Assessment is a certain percentage of the fair market value that is determined by local assessors to be the total taxable value of land and additions on the property. | Land | Improvement |
|---|---|---|---|---|
| 2025 | $4,402 | $374,400 | $74,880 | $299,520 |
| 2024 | $4,402 | $374,400 | $74,880 | $299,520 |
| 2023 | $4,402 | $314,500 | $62,900 | $251,600 |
| 2022 | $3,064 | $314,500 | $62,900 | $251,600 |
| 2021 | $3,064 | $0 | $0 | $0 |
| 2020 | $3,064 | $0 | $0 | $0 |
| 2019 | $2,828 | $0 | $0 | $0 |
| 2018 | $2,028 | $0 | $0 | $0 |
| 2017 | $2,028 | $0 | $0 | $0 |
| 2016 | $2,028 | $0 | $0 | $0 |
| 2015 | $2,475 | $0 | $0 | $0 |
| 2014 | -- | $184,700 | $37,250 | $147,450 |
| 2012 | -- | $12,160 | $787 | $11,373 |
Source: Public Records
Map
Nearby Homes
- 2544 S 2nd St
- 2211-2213 S 3rd St
- 2518 S American St
- 2504 S American St
- 113 Roseberry St
- 2442 S Philip St
- 2443 S Lee St
- 2438 S Philip St
- 2432 S Lee St
- 308 W Porter St
- 310 W Porter St
- 108 W Ritner St
- 314 Gladstone St
- 111 Fitzgerald St
- 427 W Shunk St
- 2419 S 4th St
- 433 W Shunk St
- 2411 S 4th St
- 313 Fitzgerald St
- 2429 S Lawrence St
- 2610 S Hancock St
- 2606 S Hancock St
- 2619 S 2nd St
- 2612 S Hancock St
- 2604 S Hancock St
- 2621 S 2nd St
- 2623 S 2nd St
- 2617 S 2nd St
- 2615 S 2nd St
- 2613 S 2nd St
- 2625 S 2nd St
- 2627 S 2nd St
- 2611 S 2nd St
- 2614 S Front St
- 2609 S Hancock St
- 2607 S Hancock St
- 2629 S 2nd St
- 2602 S Hancock St
- 2609 S 2nd St
- 2614 S Hancock St