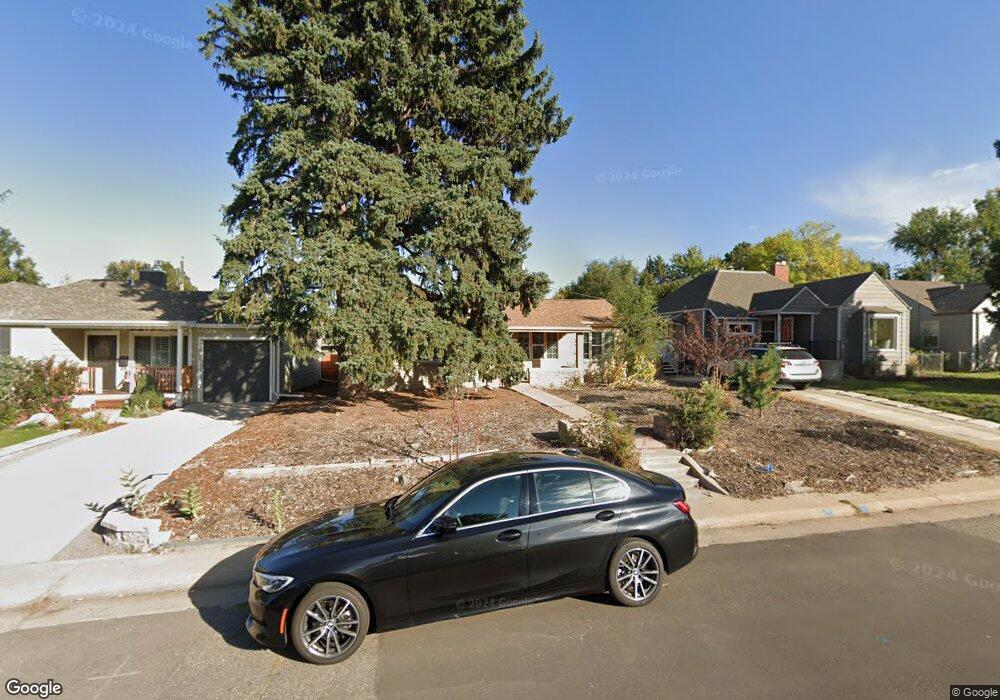
2608 S Lafayette St Denver, CO 80210
University NeighborhoodEstimated Value: $721,467 - $759,000
4
Beds
2
Baths
1,696
Sq Ft
$438/Sq Ft
Est. Value
About This Home
This home is located at 2608 S Lafayette St, Denver, CO 80210 and is currently estimated at $742,117, approximately $437 per square foot. 2608 S Lafayette St is a home located in Denver County with nearby schools including Asbury Elementary School, Grant Beacon Middle School, and South High School.
Ownership History
Date
Name
Owned For
Owner Type
Purchase Details
Closed on
Nov 5, 2020
Sold by
Ayselaf
Bought by
Apaydin Ahmet and Londono Pilar
Current Estimated Value
Purchase Details
Closed on
Jan 22, 2018
Sold by
Apaydin Ahmet and Garcia Pilar Londono
Bought by
Ayselaf
Purchase Details
Closed on
Aug 6, 2014
Sold by
Nagel Jonathan
Bought by
Apaydin Ahmed and Garcia Pilar Londono
Home Financials for this Owner
Home Financials are based on the most recent Mortgage that was taken out on this home.
Original Mortgage
$253,275
Interest Rate
4.17%
Mortgage Type
New Conventional
Purchase Details
Closed on
Oct 17, 2006
Sold by
Shoot The Moon Investments Llc
Bought by
Nagel Jonathan
Home Financials for this Owner
Home Financials are based on the most recent Mortgage that was taken out on this home.
Original Mortgage
$236,000
Interest Rate
6.37%
Mortgage Type
Purchase Money Mortgage
Create a Home Valuation Report for This Property
The Home Valuation Report is an in-depth analysis detailing your home's value as well as a comparison with similar homes in the area
Home Values in the Area
Average Home Value in this Area
Purchase History
| Date | Buyer | Sale Price | Title Company |
|---|---|---|---|
| Apaydin Ahmet | -- | None Available | |
| Ayselaf | -- | None Available | |
| Apaydin Ahmed | $337,700 | Heritage Title | |
| Nagel Jonathan | $295,000 | Security Title |
Source: Public Records
Mortgage History
| Date | Status | Borrower | Loan Amount |
|---|---|---|---|
| Previous Owner | Apaydin Ahmed | $253,275 | |
| Previous Owner | Nagel Jonathan | $236,000 |
Source: Public Records
Tax History Compared to Growth
Tax History
| Year | Tax Paid | Tax Assessment Tax Assessment Total Assessment is a certain percentage of the fair market value that is determined by local assessors to be the total taxable value of land and additions on the property. | Land | Improvement |
|---|---|---|---|---|
| 2024 | $3,229 | $40,770 | $33,980 | $6,790 |
| 2023 | $3,159 | $40,770 | $33,980 | $6,790 |
| 2022 | $2,876 | $36,170 | $26,050 | $10,120 |
| 2021 | $2,876 | $37,210 | $26,800 | $10,410 |
| 2020 | $2,566 | $34,590 | $21,210 | $13,380 |
| 2019 | $2,494 | $34,590 | $21,210 | $13,380 |
| 2018 | $2,247 | $29,050 | $20,240 | $8,810 |
| 2017 | $2,241 | $29,050 | $20,240 | $8,810 |
| 2016 | $2,128 | $26,100 | $17,401 | $8,699 |
| 2015 | $2,039 | $26,100 | $17,401 | $8,699 |
| 2014 | $2,223 | $26,770 | $14,917 | $11,853 |
Source: Public Records
Map
Nearby Homes
- 2630-2636 S Marion St
- 2630 S Marion St Unit 2636
- 2590 S Marion St
- 2705 S Humboldt St
- 2634 S Humboldt St
- 2600 S Downing St
- 2554 S Lafayette St
- 2611 S Franklin St
- 1309 E Amherst Ave
- 2770 S Franklin St
- 2480 S Lafayette St
- 2710 S Gilpin St
- 2574 S Gilpin St
- 2475 S Gilpin St
- 2417 S Lafayette St
- 2405 S Franklin St
- 2403 S Franklin St
- 2900 S Downing St
- 2377 S Humboldt St
- 2420 S Gilpin St
- 2620 S Lafayette St
- 2626 S Lafayette St
- 2632 S Lafayette St
- 2611 S Lafayette St
- 2596 S Lafayette St
- 2611 S Humboldt St
- 2615 S Lafayette St
- 2617 S Humboldt St
- 2601 S Humboldt St
- 2627 S Lafayette St
- 2642 S Lafayette St
- 2625 S Humboldt St
- 2590 S Lafayette St
- 2637 S Humboldt St
- 2595 S Lafayette St
- 2633 S Lafayette St
- 2595 S Humboldt St
- 2641 S Lafayette St
- 2585 S Humboldt St
- 2585 S Lafayette St