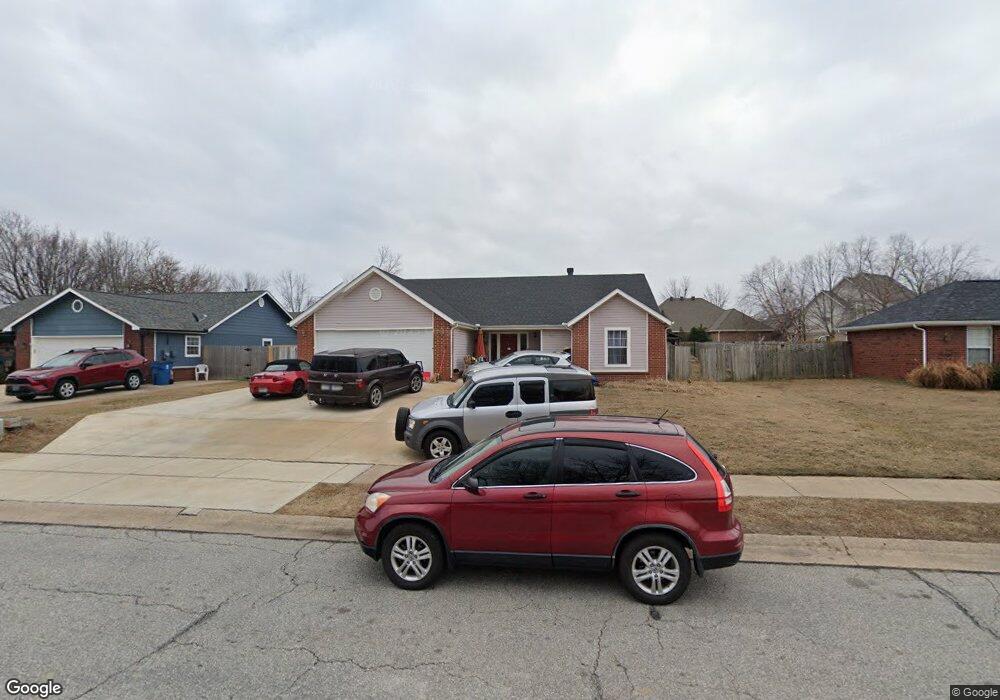
2608 SE 5th St Bentonville, AR 72712
Estimated Value: $413,000 - $486,000
3
Beds
2
Baths
1,763
Sq Ft
$246/Sq Ft
Est. Value
About This Home
This home is located at 2608 SE 5th St, Bentonville, AR 72712 and is currently estimated at $433,651, approximately $245 per square foot. 2608 SE 5th St is a home located in Benton County with nearby schools including Ruth Barker Middle School, Apple Glen Elementary School, and Washington Junior High School.
Ownership History
Date
Name
Owned For
Owner Type
Purchase Details
Closed on
Mar 17, 2011
Sold by
Federal Home Loan Mortgage Corporation
Bought by
Yang Nhia X and Yang Angelica S
Current Estimated Value
Home Financials for this Owner
Home Financials are based on the most recent Mortgage that was taken out on this home.
Original Mortgage
$104,822
Outstanding Balance
$74,384
Interest Rate
5.5%
Mortgage Type
FHA
Estimated Equity
$359,267
Purchase Details
Closed on
Nov 23, 2010
Sold by
Banks Chris J and Banks Tina J
Bought by
Federal Home Loan Mortgage Corp
Purchase Details
Closed on
Dec 4, 2002
Bought by
Banks
Purchase Details
Closed on
Jun 1, 2001
Bought by
Comiskey
Purchase Details
Closed on
Oct 30, 1996
Bought by
Bryan
Purchase Details
Closed on
Sep 2, 1994
Create a Home Valuation Report for This Property
The Home Valuation Report is an in-depth analysis detailing your home's value as well as a comparison with similar homes in the area
Home Values in the Area
Average Home Value in this Area
Purchase History
| Date | Buyer | Sale Price | Title Company |
|---|---|---|---|
| Yang Nhia X | $109,000 | Associates Closing & Title | |
| Federal Home Loan Mortgage Corp | $116,112 | None Available | |
| Banks | $130,000 | -- | |
| Comiskey | $108,000 | -- | |
| Bryan | $88,000 | -- | |
| -- | $132,000 | -- |
Source: Public Records
Mortgage History
| Date | Status | Borrower | Loan Amount |
|---|---|---|---|
| Open | Yang Nhia X | $104,822 |
Source: Public Records
Tax History Compared to Growth
Tax History
| Year | Tax Paid | Tax Assessment Tax Assessment Total Assessment is a certain percentage of the fair market value that is determined by local assessors to be the total taxable value of land and additions on the property. | Land | Improvement |
|---|---|---|---|---|
| 2025 | $2,370 | $68,082 | $19,600 | $48,482 |
| 2024 | $2,272 | $68,082 | $19,600 | $48,482 |
| 2023 | $2,164 | $46,860 | $8,600 | $38,260 |
| 2022 | $1,742 | $46,860 | $8,600 | $38,260 |
| 2021 | $1,643 | $46,860 | $8,600 | $38,260 |
| 2020 | $1,565 | $30,460 | $6,000 | $24,460 |
| 2019 | $1,565 | $30,460 | $6,000 | $24,460 |
| 2018 | $1,590 | $30,460 | $6,000 | $24,460 |
| 2017 | $1,529 | $30,460 | $6,000 | $24,460 |
| 2016 | $1,529 | $30,460 | $6,000 | $24,460 |
| 2015 | $1,822 | $29,480 | $7,000 | $22,480 |
| 2014 | $1,472 | $29,480 | $7,000 | $22,480 |
Source: Public Records
Map
Nearby Homes
- 2708 Pleasant View Ln
- 2709 Pleasant View Ln
- 2512 SE 3rd St
- 2504 SE 4th St
- 2801 SE 3rd St
- 2806 SE 3rd St
- 2202 Del White Dr
- 2401 SE 9th St
- 2301 Beth Ln
- 906 Convair St
- 501 NE Whitney St
- 600 Cornell St
- 1102 Lockheed St
- 1100 Lockheed St
- 901 Watertower Rd
- 903 Water Tower Rd
- 1126 Lockheed St
- 1126 Lockheed St
- 603 Drake St
- 701 Drake St
- 2606 SE 5th St
- 2610 SE 5th St
- 2603 SE 6th St
- 2605 SE 6th St
- 2604 SE 5th St
- 2609 SE 6th St
- 2607 SE 5th St
- 2609 SE 5th St
- 2601 SE 6th St
- 2605 SE 5th St
- 2701 SE 5th St
- 2700 SE 5th St
- 2606 SE 6th St
- 600 SE Jamaica Dr
- 1 Honeysuckle Ct
- 600 Paradise Way
- 2701 SE 6th St
- 411 Parkcrest Dr
- 3 Honeysuckle Ct
- 2608 Parkcrest Dr