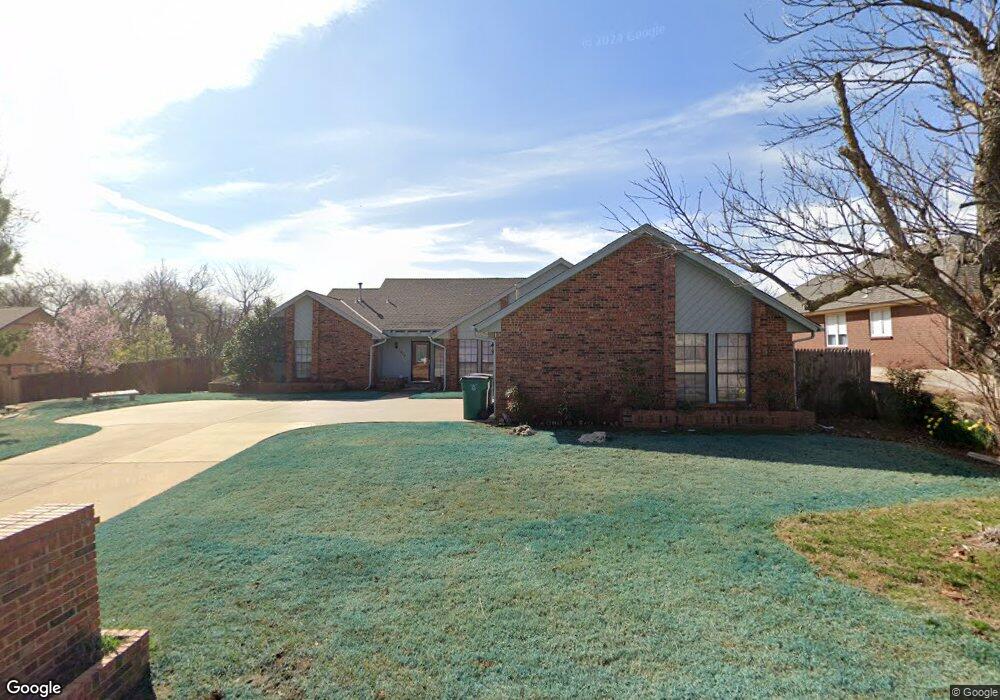
2608 SW 113th St Oklahoma City, OK 73170
Lakeridge Run NeighborhoodEstimated Value: $302,400 - $321,000
3
Beds
2
Baths
2,290
Sq Ft
$137/Sq Ft
Est. Value
About This Home
This home is located at 2608 SW 113th St, Oklahoma City, OK 73170 and is currently estimated at $314,600, approximately $137 per square foot. 2608 SW 113th St is a home located in Cleveland County with nearby schools including Fisher Elementary School, Brink Junior High School, and Westmoore High School.
Ownership History
Date
Name
Owned For
Owner Type
Purchase Details
Closed on
Sep 30, 2025
Sold by
Bays Carol J
Bought by
English & Company Llc
Current Estimated Value
Home Financials for this Owner
Home Financials are based on the most recent Mortgage that was taken out on this home.
Original Mortgage
$238,380
Outstanding Balance
$238,380
Interest Rate
6.58%
Mortgage Type
New Conventional
Estimated Equity
$76,220
Purchase Details
Closed on
Jun 27, 2025
Sold by
Bays Carol J
Bought by
Carol J Bays Revocable Living Trust and Bays
Purchase Details
Closed on
Jun 15, 2005
Sold by
King Sharon C and King Edward R
Bought by
Bays Donald C and Bays Carol J
Home Financials for this Owner
Home Financials are based on the most recent Mortgage that was taken out on this home.
Original Mortgage
$144,000
Interest Rate
5.76%
Mortgage Type
New Conventional
Purchase Details
Closed on
May 16, 2003
Sold by
Reed Darrell W
Bought by
King Sharon C and King Edward R
Create a Home Valuation Report for This Property
The Home Valuation Report is an in-depth analysis detailing your home's value as well as a comparison with similar homes in the area
Home Values in the Area
Average Home Value in this Area
Purchase History
| Date | Buyer | Sale Price | Title Company |
|---|---|---|---|
| English & Company Llc | $188,000 | American Eagle Title | |
| Carol J Bays Revocable Living Trust | -- | None Listed On Document | |
| Carol J Bays Revocable Living Trust | -- | None Listed On Document | |
| Bays Donald C | $180,000 | None Available | |
| King Sharon C | $160,500 | -- |
Source: Public Records
Mortgage History
| Date | Status | Borrower | Loan Amount |
|---|---|---|---|
| Open | English & Company Llc | $238,380 | |
| Previous Owner | Bays Donald C | $144,000 |
Source: Public Records
Tax History Compared to Growth
Tax History
| Year | Tax Paid | Tax Assessment Tax Assessment Total Assessment is a certain percentage of the fair market value that is determined by local assessors to be the total taxable value of land and additions on the property. | Land | Improvement |
|---|---|---|---|---|
| 2024 | $2,669 | $22,929 | $4,717 | $18,212 |
| 2023 | $2,600 | $22,262 | $3,891 | $18,371 |
| 2022 | $2,554 | $21,613 | $4,760 | $16,853 |
| 2021 | $2,469 | $20,984 | $4,736 | $16,248 |
| 2020 | $2,403 | $20,373 | $3,600 | $16,773 |
| 2019 | $2,432 | $20,373 | $3,600 | $16,773 |
| 2018 | $2,458 | $20,373 | $3,600 | $16,773 |
| 2017 | $2,462 | $20,373 | $0 | $0 |
| 2016 | $2,450 | $20,089 | $3,550 | $16,539 |
| 2015 | $2,195 | $19,504 | $3,446 | $16,058 |
| 2014 | $2,163 | $18,937 | $2,567 | $16,370 |
Source: Public Records
Map
Nearby Homes
- 2613 SW 112th St
- 11433 Lakeridge Run
- 11452 Lakeridge Run
- 11604 Gateshead Dr
- 11321 Fountain Blvd
- 11205 S Linn Ave
- 2821 SW 116th St
- 11905 Stonehedge Ave
- 11309 Greenbriar Chase
- 2832 SW 108th St
- 11824 Autumn Leaves
- 2608 SW 107th St
- 2116 Dansmere Ave
- 2208 Amber Rd
- 2701 SW 121st St
- 2208 SW 117th St
- 12217 Lorien Way
- 10305 S Fairview Dr
- 12141 Greenlawn Ave
- 2309 SW 105th Ct
- 2612 SW 113th St
- 11504 Country Dr
- 2604 SW 113th St
- 11508 Country Dr
- 2616 SW 113th St
- 11500 Country Dr
- 2609 SW 113th St
- 2605 SW 113th St
- 2600 SW 113th St
- 2620 SW 113th St
- 2601 SW 113th St
- 11512 Country Dr
- 11501 Country Dr
- 11509 Country Dr
- 11308 Country Dr
- 2700 SW 113th St
- 11313 Country Dr
- 11505 Country Dr
- 11516 Country Dr
- 2616 SW 112th St