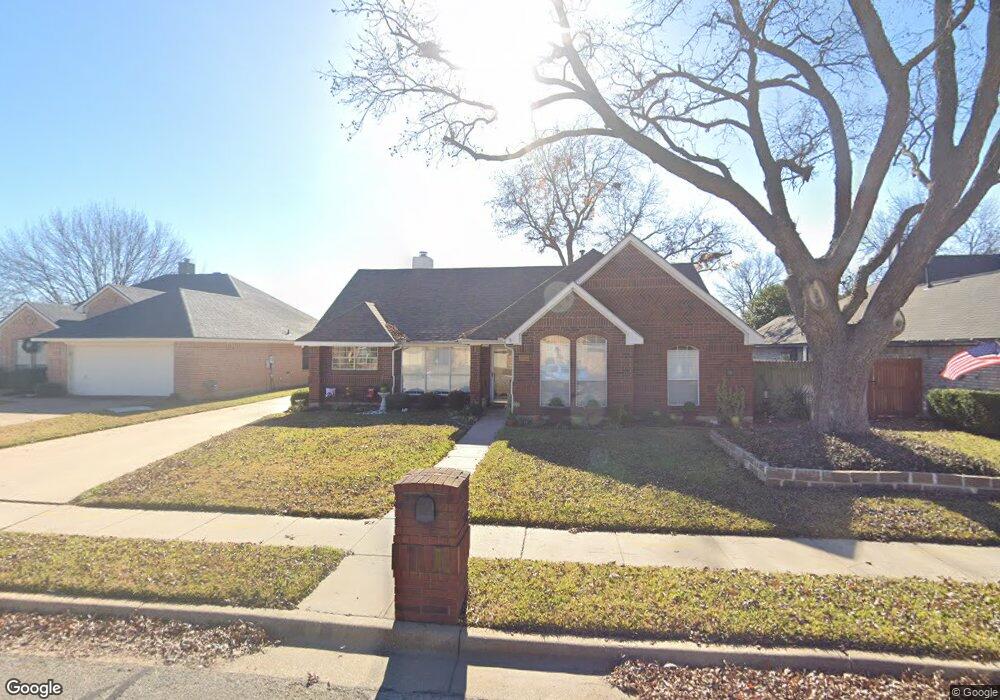
2608 Tall Meadow Ct Bedford, TX 76021
Estimated Value: $379,751 - $436,000
3
Beds
2
Baths
1,790
Sq Ft
$230/Sq Ft
Est. Value
About This Home
This home is located at 2608 Tall Meadow Ct, Bedford, TX 76021 and is currently estimated at $411,938, approximately $230 per square foot. 2608 Tall Meadow Ct is a home located in Tarrant County with nearby schools including Meadow Creek Elementary School, Harwood Junior High School, and Trinity High School.
Ownership History
Date
Name
Owned For
Owner Type
Purchase Details
Closed on
Nov 10, 2014
Sold by
Chambers Fred M and Chambers Loydean
Bought by
Nye Douglas and Nye Jean
Current Estimated Value
Home Financials for this Owner
Home Financials are based on the most recent Mortgage that was taken out on this home.
Original Mortgage
$107,000
Outstanding Balance
$82,655
Interest Rate
4.23%
Mortgage Type
New Conventional
Estimated Equity
$329,283
Purchase Details
Closed on
Jun 26, 2014
Sold by
Patterson Orvil L and Patterson Wanda
Bought by
Chambers Fred M and Chambers Loydean
Home Financials for this Owner
Home Financials are based on the most recent Mortgage that was taken out on this home.
Original Mortgage
$135,000
Interest Rate
4.19%
Mortgage Type
Purchase Money Mortgage
Create a Home Valuation Report for This Property
The Home Valuation Report is an in-depth analysis detailing your home's value as well as a comparison with similar homes in the area
Home Values in the Area
Average Home Value in this Area
Purchase History
| Date | Buyer | Sale Price | Title Company |
|---|---|---|---|
| Nye Douglas | -- | None Available | |
| Chambers Fred M | -- | None Available |
Source: Public Records
Mortgage History
| Date | Status | Borrower | Loan Amount |
|---|---|---|---|
| Open | Nye Douglas | $107,000 | |
| Previous Owner | Chambers Fred M | $135,000 |
Source: Public Records
Tax History Compared to Growth
Tax History
| Year | Tax Paid | Tax Assessment Tax Assessment Total Assessment is a certain percentage of the fair market value that is determined by local assessors to be the total taxable value of land and additions on the property. | Land | Improvement |
|---|---|---|---|---|
| 2025 | $1,668 | $323,474 | $80,000 | $243,474 |
| 2024 | $1,668 | $375,742 | $80,000 | $295,742 |
| 2023 | $6,056 | $358,126 | $60,000 | $298,126 |
| 2022 | $6,270 | $303,555 | $60,000 | $243,555 |
| 2021 | $6,147 | $260,967 | $60,000 | $200,967 |
| 2020 | $6,242 | $262,549 | $60,000 | $202,549 |
| 2019 | $6,417 | $264,131 | $60,000 | $204,131 |
| 2018 | $3,186 | $242,513 | $60,000 | $182,513 |
| 2017 | $5,333 | $238,989 | $35,000 | $203,989 |
| 2016 | $4,849 | $200,424 | $35,000 | $165,424 |
| 2015 | $3,157 | $198,427 | $35,000 | $163,427 |
| 2014 | $3,157 | $167,500 | $25,000 | $142,500 |
Source: Public Records
Map
Nearby Homes
- 2601 Murphy Dr
- 2516 Classic Ct W
- 2501 Murphy Dr
- 2609 Woodson Dr
- 2700 Mimosa Ct
- 2521 Sanders Ct
- 2417 Meadow Ct
- 2616 Greenwood Ct
- 2300 Folkstone Way
- 2922 Beachtree Ln
- 3024 Highgate Ln
- 2600 Willow Bend
- 2909 Oakridge Dr
- 2709 Willow Bend
- 2522 Durango Ridge Dr
- 2220 Tiffany Glenn Ct
- 2109 Oakmeadow St
- 3152 Woodbridge Dr
- 2024 Oakmeadow St
- 2112 Oakmeadow Place
- 2604 Tall Meadow Ct
- 2612 Tall Meadow Ct
- 2600 Tall Meadow Ct
- 2616 Tall Meadow Ct
- 2609 Tall Meadow Ct
- 2514 Murphy Dr
- 2605 Tall Meadow Ct
- 2613 Tall Meadow Ct
- 2620 Tall Meadow Ct
- 2601 Tall Meadow Ct
- 2617 Tall Meadow Ct
- 2612 Classic Ct E
- 2508 Murphy Dr
- 2608 Classic Ct E
- 2604 Classic Ct E
- 2600 Classic Ct E
- 2616 Classic Ct E
- 2513 Murphy Dr
- 2605 Murphy Dr
- 2520 Classic Ct W