
Estimated payment $2,510/month
Total Views
771
4
Beds
2
Baths
1,722
Sq Ft
$253
Price per Sq Ft
Highlights
- Very Popular Property
- Lake View
- Mature Trees
- RV or Boat Parking
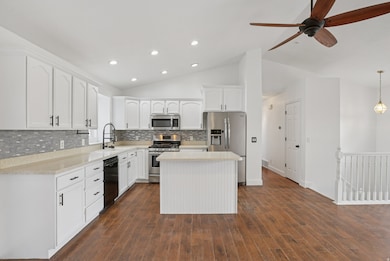
- Updated Kitchen
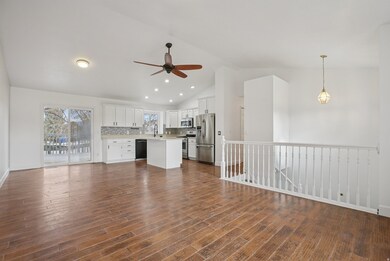
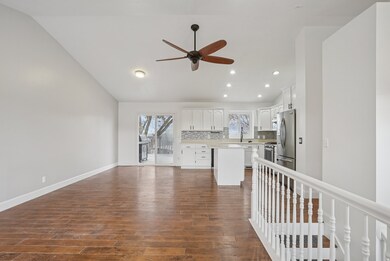
- Vaulted Ceiling
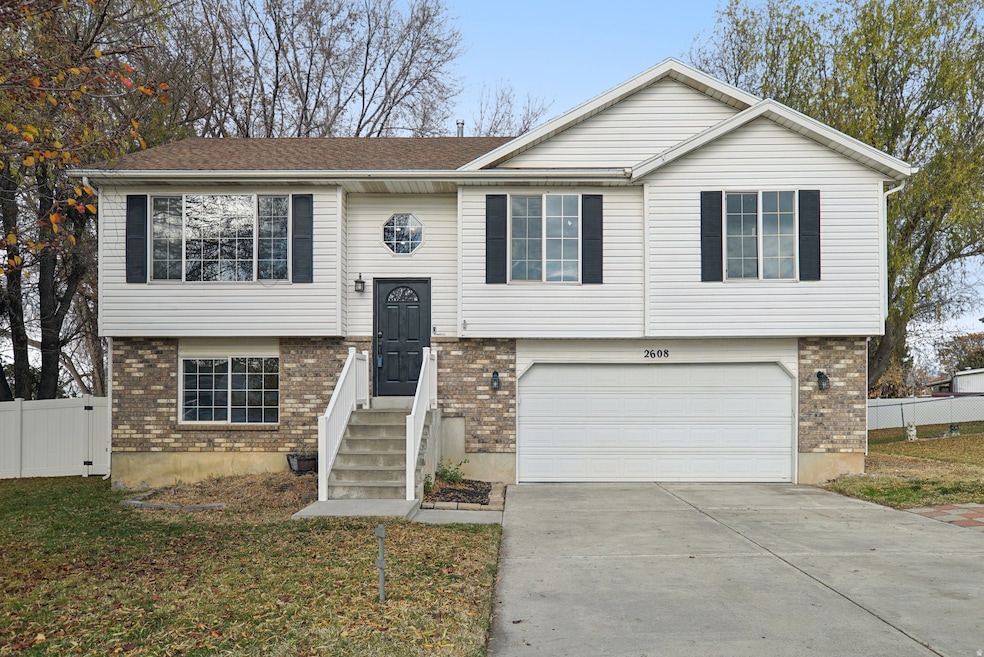
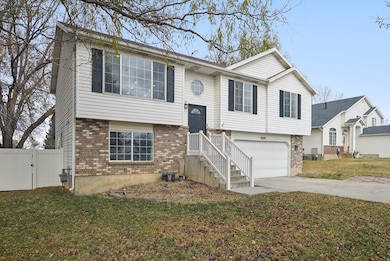
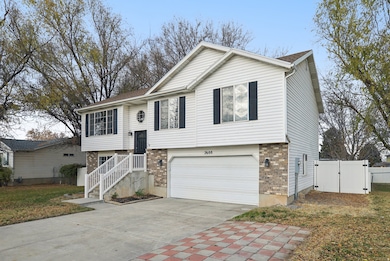
About This Home
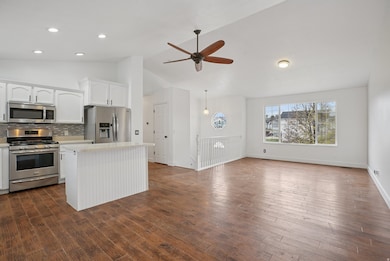
Discover modern living in this beautifully updated 4-bedroom, 2-bath home located just minutes from Ogden Airport. Enjoy a bright, open layout featuring stylish finishes and stainless steel appliances included. The spacious, fully fenced backyard offers plenty of room to relax, entertain, or play. Move-in ready and ideally situated near shopping, dining, and commuter routes-this home has it all! Schedule your showing today!
Home Details
Home Type
- Single Family
Est. Annual Taxes
- $2,669
Year Built
- Built in 1999
Lot Details
- 7,841 Sq Ft Lot
- Property is Fully Fenced
- Landscaped
- Mature Trees
- Pine Trees
- Property is zoned Single-Family
Parking
- 2 Car Garage
- 3 Open Parking Spaces
- RV or Boat Parking
Property Views
- Lake
- Mountain
Home Design
- Split Level Home
- Brick Exterior Construction
Interior Spaces
- 1,722 Sq Ft Home
- 2-Story Property
- Vaulted Ceiling
- Double Pane Windows
- Blinds
- French Doors
- Sliding Doors
- Great Room
- Partial Basement
- Gas Dryer Hookup
Kitchen
- Updated Kitchen
- Gas Oven
- Gas Range
- Free-Standing Range
- Microwave
- Disposal
Flooring
- Wood
- Carpet
- Vinyl
Bedrooms and Bathrooms
- 4 Bedrooms | 3 Main Level Bedrooms
- Primary Bedroom on Main
- 2 Full Bathrooms
Schools
- Valley View Elementary School
- Sand Ridge Middle School
- Roy High School
Utilities
- Forced Air Heating and Cooling System
- Natural Gas Connected
Additional Features
- Reclaimed Water Irrigation System
- Outdoor Gas Grill
Community Details
- No Home Owners Association
- Edgewater Subdivision
Listing and Financial Details
- Home warranty included in the sale of the property
- Assessor Parcel Number 08-289-0009
Map
Create a Home Valuation Report for This Property
The Home Valuation Report is an in-depth analysis detailing your home's value as well as a comparison with similar homes in the area
Home Values in the Area
Average Home Value in this Area
Tax History
| Year | Tax Paid | Tax Assessment Tax Assessment Total Assessment is a certain percentage of the fair market value that is determined by local assessors to be the total taxable value of land and additions on the property. | Land | Improvement |
|---|---|---|---|---|
| 2025 | $2,669 | $424,107 | $135,012 | $289,095 |
| 2024 | $2,555 | $224,399 | $74,256 | $150,143 |
| 2023 | $2,352 | $205,700 | $71,317 | $134,383 |
| 2022 | $2,672 | $243,650 | $60,501 | $183,149 |
| 2021 | $2,095 | $312,000 | $75,002 | $236,998 |
| 2020 | $2,020 | $277,000 | $75,002 | $201,998 |
| 2019 | $1,946 | $251,000 | $49,906 | $201,094 |
| 2018 | $1,781 | $215,000 | $44,976 | $170,024 |
| 2017 | $1,667 | $188,000 | $43,029 | $144,971 |
| 2016 | $1,621 | $98,440 | $24,773 | $73,667 |
| 2015 | $1,471 | $90,961 | $24,773 | $66,188 |
| 2014 | $1,404 | $85,396 | $21,944 | $63,452 |
Source: Public Records
Property History
| Date | Event | Price | List to Sale | Price per Sq Ft |
|---|---|---|---|---|
| 12/10/2025 12/10/25 | For Sale | $435,000 | -- | $253 / Sq Ft |
Source: UtahRealEstate.com
Purchase History
| Date | Type | Sale Price | Title Company |
|---|---|---|---|
| Warranty Deed | -- | Metro National Title | |
| Interfamily Deed Transfer | -- | Heritage West Title Be | |
| Warranty Deed | -- | Us Title Insurance Agency | |
| Warranty Deed | -- | First American Title |
Source: Public Records
Mortgage History
| Date | Status | Loan Amount | Loan Type |
|---|---|---|---|
| Open | $350,000 | New Conventional | |
| Previous Owner | $150,719 | FHA | |
| Previous Owner | $123,497 | VA |
Source: Public Records
About the Listing Agent
Adam Speth is one of Northern Utah’s most trusted and accomplished real estate professionals, serving Layton, Kaysville, Syracuse, Clearfield, Ogden, and the greater Davis/Weber County markets. With 21+ years of full-time experience, 1000+ homes sold, and the honor of being named the 2024 REALTOR® of the Year, Adam is known for his deep market expertise, strong negotiation skills, and a signature “high-vibe, high-performance” client experience.
As the leader of The Speth Group at RE/MAX,
Adam's Other Listings
Source: UtahRealEstate.com
MLS Number: 2126399
APN: 08-289-0009
Disclaimer: Certain information contained herein is derived from information provided by parties other than Homes.com. All information provided is deemed reliable, but is not guaranteed to be accurate and should be independently verified.
![]() IDX information is provided exclusively for consumers’ personal, non-commercial use, that it may not be used for any purpose other than to identify prospective properties consumers may be interested in purchasing, and that the data is deemed reliable but is not guaranteed accurate by the MLS. Licensor is only providing the MLS Content and not other sources of data provided in the Product.
IDX information is provided exclusively for consumers’ personal, non-commercial use, that it may not be used for any purpose other than to identify prospective properties consumers may be interested in purchasing, and that the data is deemed reliable but is not guaranteed accurate by the MLS. Licensor is only providing the MLS Content and not other sources of data provided in the Product.
Based on information from the Wasatch Front Regional Multiple Listing Service, Inc.. All data, including all measurements and calculations of area, is obtained from various sources and has not been, and will not be, verified by broker or the MLS. All information should be independently reviewed and verified for accuracy. Properties may or may not be listed by the office/agent presenting the information.
Nearby Homes
- 3860 S Midland Dr Unit B97
- 3860 S Midland Dr Unit B59
- 3860 S Midland Dr Unit B 51
- 3750 S Midland Dr Unit 80
- 3750 S Midland Dr Unit 189
- 3750 S Midland Dr
- 3750 Midland Dr Unit 169
- 3860 Midland Dr Unit C10
- 3860 Midland Dr Unit A18
- 3860 Midland Dr Unit B32
- 4118 Westlake Dr
- 4110 S 2275 W
- 3928 S 2225 W
- 2777 W 4175 S Unit 229
- 4073 S 2175 W
- 2917 W 3970 S Unit 53
- 3963 S 2925 W
- 2096 W 3950 S
- 3891 S 2940 W
- 3866 S 2970 W
- 2602 W 4050 S
- 2405 Hinckley Dr
- 4389 S Locomotive Dr
- 4419 S 2750 W
- 2225 W 4350 S
- 3024 W 4450 S
- 3329 W 3745 S
- 4621 S W Pk Dr
- 3330 W 4000 S
- 2619 W 4650 S
- 2112 W 3300 S
- 4499 S 1930 W
- 4536 S 1900 W Unit 12
- 2575 W 4800 S
- 1934 W 4700 S Unit 1
- 4539 S 1800 W
- 1801 W 4650 S
- 5000 S 1900 W
- 3652 W 4625 S
- 5239 S 2700 W