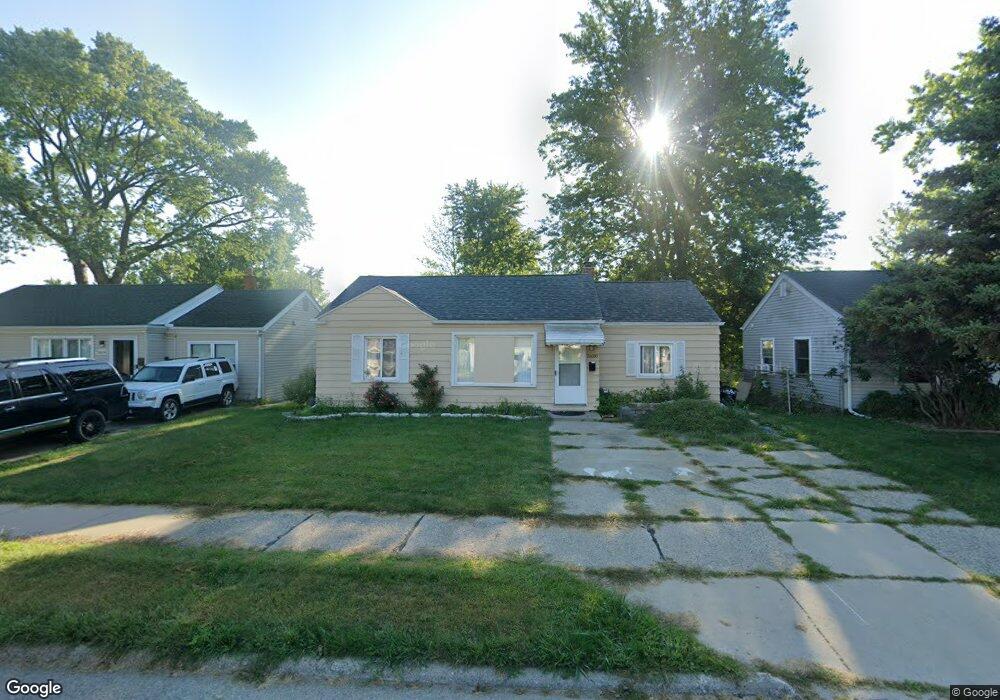
26080 Nagel St Roseville, MI 48066
Estimated Value: $127,000 - $148,000
3
Beds
1
Bath
924
Sq Ft
$148/Sq Ft
Est. Value
About This Home
This home is located at 26080 Nagel St, Roseville, MI 48066 and is currently estimated at $137,058, approximately $148 per square foot. 26080 Nagel St is a home located in Macomb County with nearby schools including Dort Elementary School, Kaiser Elementary School, and Joseph G. Steenland Elementary School.
Ownership History
Date
Name
Owned For
Owner Type
Purchase Details
Closed on
May 8, 2018
Sold by
Quadrini Aldo and Quadrini Louise
Bought by
Herubin Brian
Current Estimated Value
Purchase Details
Closed on
Feb 15, 2012
Sold by
Quadrini Aldo
Bought by
Quadrini Aldo and Quadrini Louise
Purchase Details
Closed on
Mar 10, 2011
Sold by
Secretary Of Housing & Urban Development
Bought by
Quadrini Aldo
Purchase Details
Closed on
May 27, 2010
Sold by
Matrix Financial Services Corporation
Bought by
The Secretary Of Housing & Urban Develop
Purchase Details
Closed on
Jan 29, 2010
Sold by
Declerck Thomas D
Bought by
Matrix Financial Services Corporation
Purchase Details
Closed on
Mar 7, 2001
Sold by
Patrick Mary A
Bought by
Declerck Thomas D
Home Financials for this Owner
Home Financials are based on the most recent Mortgage that was taken out on this home.
Original Mortgage
$69,324
Interest Rate
7.03%
Create a Home Valuation Report for This Property
The Home Valuation Report is an in-depth analysis detailing your home's value as well as a comparison with similar homes in the area
Home Values in the Area
Average Home Value in this Area
Purchase History
| Date | Buyer | Sale Price | Title Company |
|---|---|---|---|
| Herubin Brian | -- | None Available | |
| Quadrini Aldo | -- | None Available | |
| Quadrini Aldo | $13,300 | None Available | |
| The Secretary Of Housing & Urban Develop | -- | None Available | |
| Matrix Financial Services Corporation | $70,895 | None Available | |
| Declerck Thomas D | $69,900 | -- |
Source: Public Records
Mortgage History
| Date | Status | Borrower | Loan Amount |
|---|---|---|---|
| Previous Owner | Declerck Thomas D | $69,324 |
Source: Public Records
Tax History Compared to Growth
Tax History
| Year | Tax Paid | Tax Assessment Tax Assessment Total Assessment is a certain percentage of the fair market value that is determined by local assessors to be the total taxable value of land and additions on the property. | Land | Improvement |
|---|---|---|---|---|
| 2025 | $1,372 | $55,300 | $0 | $0 |
| 2024 | $728 | $53,100 | $0 | $0 |
| 2023 | $1,255 | $46,300 | $0 | $0 |
| 2022 | $1,658 | $40,200 | $0 | $0 |
| 2021 | $1,584 | $35,900 | $0 | $0 |
| 2020 | $679 | $32,800 | $0 | $0 |
| 2019 | $1,044 | $27,100 | $0 | $0 |
| 2018 | $1,024 | $0 | $0 | $0 |
| 2017 | $956 | $21,320 | $6,805 | $14,515 |
| 2016 | $950 | $21,320 | $0 | $0 |
| 2015 | $671 | $18,619 | $0 | $0 |
| 2013 | -- | $19,134 | $0 | $0 |
| 2011 | -- | $22,527 | $0 | $0 |
Source: Public Records
Map
Nearby Homes
- 26140 Nagel St
- 26204 Belanger St
- 26211 Clancy St
- 26342 Grandmont St
- 26584 Kathy St
- 15738 Frazho Rd
- 26621 Kathy St
- 15676 Frazho Rd
- 26354 Dale Ct
- 26700 Belanger St
- 16250 Guest Ct
- 26620 Academy St
- 26750 Belanger St
- 15329 Petrie St
- 26291 Compson St
- 26371 Compson St
- 15214 Petrie St
- 25673 Ford St
- 26730 Ridgemont St
- 26070 Bryan St
- 26090 Nagel St
- 26070 Nagel St
- 26100 Nagel St
- 26060 Nagel St
- 26093 Kathy St
- 26083 Kathy St
- 26050 Nagel St
- 26103 Kathy St
- 26073 Kathy St
- 26247 Kathy St
- 26103 Nagel St
- 26040 Nagel St
- 26120 Nagel St
- 26093 Nagel St
- 26063 Kathy St
- 26113 Nagel St
- 26259 Kathy St
- 26091 Nagel St
- 26123 Nagel St
- 26083 Nagel St Unit Bldg-Unit