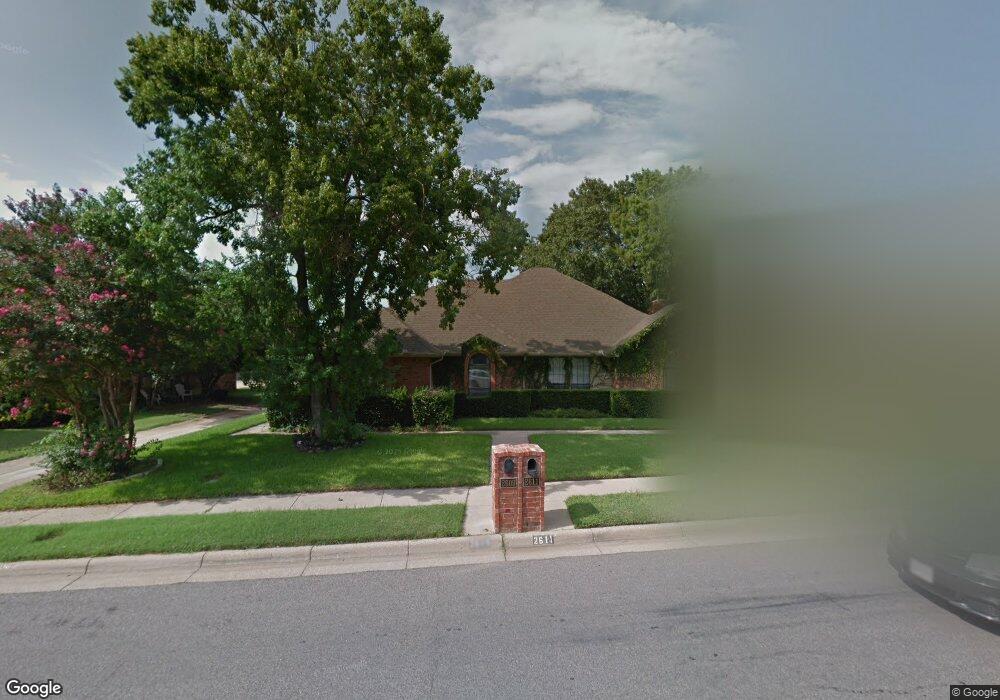
2609 Cummings Dr Bedford, TX 76021
Estimated Value: $311,235 - $340,000
2
Beds
2
Baths
1,261
Sq Ft
$258/Sq Ft
Est. Value
About This Home
This home is located at 2609 Cummings Dr, Bedford, TX 76021 and is currently estimated at $325,309, approximately $257 per square foot. 2609 Cummings Dr is a home located in Tarrant County with nearby schools including Spring Garden Elementary School, Harwood Junior High School, and Trinity High School.
Ownership History
Date
Name
Owned For
Owner Type
Purchase Details
Closed on
Sep 23, 2022
Sold by
Mosby Holdings Llc
Bought by
Cereceres Lizette
Current Estimated Value
Home Financials for this Owner
Home Financials are based on the most recent Mortgage that was taken out on this home.
Original Mortgage
$284,900
Outstanding Balance
$272,123
Interest Rate
5.22%
Mortgage Type
FHA
Estimated Equity
$53,186
Purchase Details
Closed on
May 3, 2021
Sold by
Stark Norma
Bought by
Mosby Holdings Llc
Purchase Details
Closed on
Apr 3, 2012
Sold by
Hoffman Julia A and Hoffman Allan J
Bought by
Stark Norma
Purchase Details
Closed on
Aug 16, 2011
Sold by
Omalley Mary V
Bought by
Hoffman Julia A and Hoffman Allan J
Purchase Details
Closed on
Nov 1, 1996
Sold by
Summers Jon R and Doyle Michael J
Bought by
Stark B E B and Stark Norma
Create a Home Valuation Report for This Property
The Home Valuation Report is an in-depth analysis detailing your home's value as well as a comparison with similar homes in the area
Home Values in the Area
Average Home Value in this Area
Purchase History
| Date | Buyer | Sale Price | Title Company |
|---|---|---|---|
| Cereceres Lizette | -- | Independence Title Company | |
| Mosby Holdings Llc | -- | Fidelity National Title | |
| Stark Norma | -- | None Available | |
| Hoffman Julia A | -- | Hftc | |
| Stark B E B | -- | Commonwealth Land Title |
Source: Public Records
Mortgage History
| Date | Status | Borrower | Loan Amount |
|---|---|---|---|
| Open | Cereceres Lizette | $284,900 |
Source: Public Records
Tax History Compared to Growth
Tax History
| Year | Tax Paid | Tax Assessment Tax Assessment Total Assessment is a certain percentage of the fair market value that is determined by local assessors to be the total taxable value of land and additions on the property. | Land | Improvement |
|---|---|---|---|---|
| 2025 | $4,644 | $288,000 | $45,000 | $243,000 |
| 2024 | $4,644 | $302,593 | $45,000 | $257,593 |
| 2023 | $5,592 | $291,549 | $15,000 | $276,549 |
| 2022 | $3,558 | $162,891 | $15,000 | $147,891 |
| 2021 | $3,865 | $164,084 | $15,000 | $149,084 |
| 2020 | $3,930 | $165,276 | $15,000 | $150,276 |
| 2019 | $3,816 | $166,469 | $15,000 | $151,469 |
| 2018 | $1,043 | $142,790 | $15,000 | $127,790 |
| 2017 | $3,174 | $143,788 | $15,000 | $128,788 |
| 2016 | $2,886 | $119,283 | $15,000 | $104,283 |
| 2015 | $1,107 | $110,400 | $15,000 | $95,400 |
| 2014 | $1,107 | $110,400 | $15,000 | $95,400 |
Source: Public Records
Map
Nearby Homes
- 3152 Woodbridge Dr
- 3721 Fieldcrest Ln
- 3017 Bluebonnet Ln
- 2305 Meadowlark Ln
- 2609 Talisman Ct
- 3816 Rolling Meadows Dr
- 2209 Laurel Ct
- 2600 Willow Bend
- 3840 Edgewater Dr
- 3405 Scenic Hills Dr
- 3024 Highgate Ln
- Seaberry II Plan at Grace Park - Signature Series
- Primrose FE V Plan at Grace Park - Signature Series
- Hawthorne Plan at Grace Park - Signature Series
- Seaberry Plan at Grace Park - Signature Series
- Gardenia Plan at Grace Park - Signature Series
- Bellflower IV Plan at Grace Park - Signature Series
- Bellflower II Plan at Grace Park - Signature Series
- Carolina IV Plan at Grace Park - Signature Series
- Carolina Plan at Grace Park - Signature Series
- 2611 Cummings Dr
- 2607 Cummings Dr
- 2613 Cummings Dr
- 2605 Cummings Dr
- 2615 Cummings Dr
- 3601 Greenway Dr
- 2600 Ashwood Ln
- 2617 Cummings Dr
- 2404 Fox Glenn Cir
- 2619 Cummings Dr
- 2408 Fox Glenn Cir
- 2604 Ashwood Ln
- 2400 Fox Glenn Cir
- 2621 Cummings Dr
- 3605 Greenway Dr
- 2623 Cummings Dr
- 2608 Ashwood Ln
- 2412 Fox Glenn Cir
- 2625 Cummings Dr
- 3609 Greenway Dr