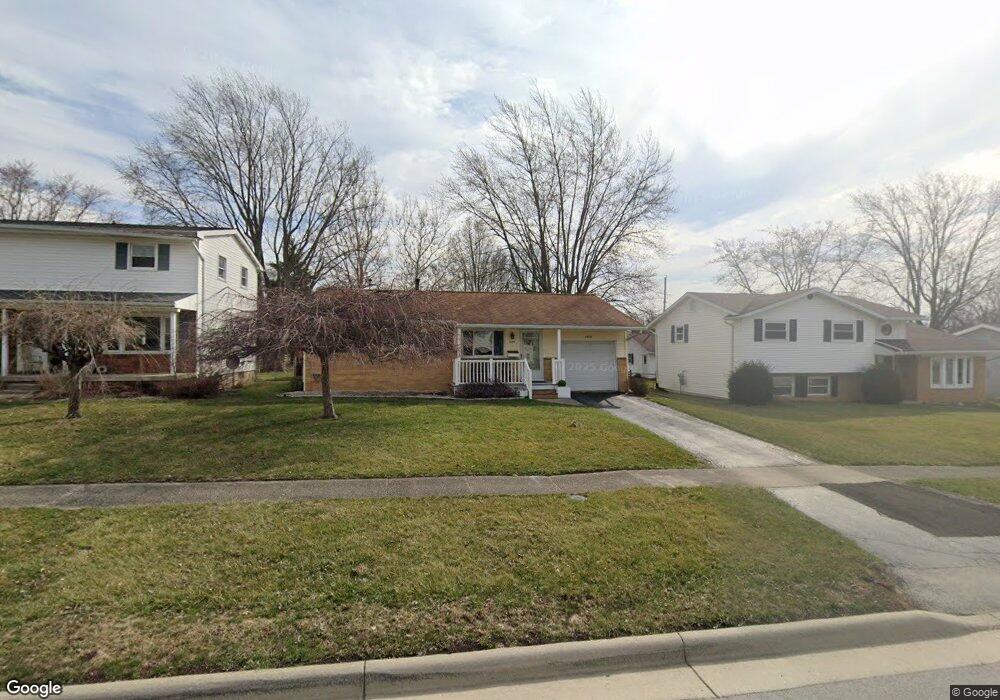
2609 Eton Place Findlay, OH 45840
Estimated Value: $179,068 - $198,000
3
Beds
1
Bath
1,060
Sq Ft
$181/Sq Ft
Est. Value
About This Home
This home is located at 2609 Eton Place, Findlay, OH 45840 and is currently estimated at $192,017, approximately $181 per square foot. 2609 Eton Place is a home located in Hancock County with nearby schools including Northview Elementary School, Bigelow Hill Elementary School, and Glenwood Middle School.
Ownership History
Date
Name
Owned For
Owner Type
Purchase Details
Closed on
Oct 29, 1999
Sold by
Westover Richard G
Bought by
Daugherty Pamela L
Current Estimated Value
Home Financials for this Owner
Home Financials are based on the most recent Mortgage that was taken out on this home.
Original Mortgage
$49,000
Outstanding Balance
$15,096
Interest Rate
7.87%
Mortgage Type
New Conventional
Estimated Equity
$176,921
Purchase Details
Closed on
Aug 24, 1995
Sold by
Wise Randy
Bought by
Westover Richard
Home Financials for this Owner
Home Financials are based on the most recent Mortgage that was taken out on this home.
Original Mortgage
$73,848
Interest Rate
7.43%
Mortgage Type
VA
Purchase Details
Closed on
May 15, 1990
Bought by
Wise Randy S and Wise Susan L
Purchase Details
Closed on
Aug 2, 1982
Bought by
Jomantas Helen M
Create a Home Valuation Report for This Property
The Home Valuation Report is an in-depth analysis detailing your home's value as well as a comparison with similar homes in the area
Home Values in the Area
Average Home Value in this Area
Purchase History
| Date | Buyer | Sale Price | Title Company |
|---|---|---|---|
| Daugherty Pamela L | $89,000 | -- | |
| Westover Richard | $72,400 | -- | |
| Wise Randy S | $52,000 | -- | |
| Jomantas Helen M | $36,900 | -- |
Source: Public Records
Mortgage History
| Date | Status | Borrower | Loan Amount |
|---|---|---|---|
| Open | Daugherty Pamela L | $49,000 | |
| Previous Owner | Westover Richard | $73,848 |
Source: Public Records
Tax History Compared to Growth
Tax History
| Year | Tax Paid | Tax Assessment Tax Assessment Total Assessment is a certain percentage of the fair market value that is determined by local assessors to be the total taxable value of land and additions on the property. | Land | Improvement |
|---|---|---|---|---|
| 2024 | $1,182 | $43,070 | $6,640 | $36,430 |
| 2023 | $1,206 | $43,070 | $6,640 | $36,430 |
| 2022 | $1,224 | $43,070 | $6,640 | $36,430 |
| 2021 | $1,086 | $35,440 | $6,630 | $28,810 |
| 2020 | $1,086 | $35,440 | $6,630 | $28,810 |
| 2019 | $1,551 | $35,440 | $6,630 | $28,810 |
| 2018 | $1,499 | $31,950 | $5,520 | $26,430 |
| 2017 | $695 | $31,950 | $5,520 | $26,430 |
| 2016 | $1,376 | $31,950 | $5,520 | $26,430 |
| 2015 | $1,230 | $28,140 | $5,520 | $22,620 |
| 2014 | $1,231 | $28,140 | $5,520 | $22,620 |
| 2012 | $1,220 | $27,700 | $5,520 | $22,180 |
Source: Public Records
Map
Nearby Homes
- 506 Hillcrest Ave
- 615 Hillcrest Ave
- 128 Harrington Ave
- 643 Edith Ave
- 126 Hillcrest Ave
- 232 Prentiss Ave
- 3300 Crosshill Dr
- 1934 Geffs Ave
- 933 Laurel Ln
- 304 Rector Ave
- 905 W Melrose Ave
- 233 Bell Ave
- 925 W Melrose Ave
- 405 Clifton Ave
- 2100 Candlewick Dr
- 1820 N Main St
- 410 Monroe Ave
- 1310 Muirfield Dr
- 3239 N Main St
- 1825 Pershing St
- 2613 Eton Place
- 2605 Eton Place
- 2617 Eton Place
- 2601 Eton Place
- 410 Edinborough Dr
- 2612 Oxford Dr
- 2618 Oxford Dr
- 2621 Eton Place
- 400 Edinborough Dr
- 2608 Eton Place
- 2612 Eton Place
- 2604 Eton Place
- 2624 Oxford Dr
- 2616 Eton Place
- 500 Edinborough Dr
- 2625 Eton Place
- 2620 Eton Place
- 2630 Oxford Dr
- 415 Edinborough Dr
- 425 Edinborough Dr