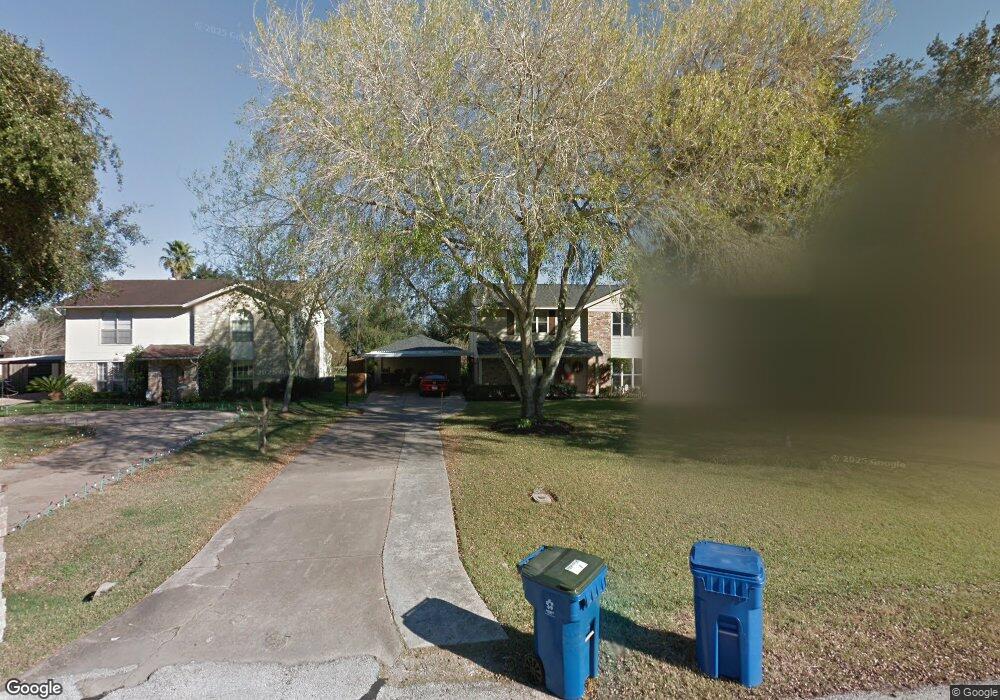
2609 Lory St Rosenberg, TX 77471
Estimated Value: $357,000 - $414,000
3
Beds
2
Baths
2,602
Sq Ft
$146/Sq Ft
Est. Value
About This Home
This home is located at 2609 Lory St, Rosenberg, TX 77471 and is currently estimated at $380,468, approximately $146 per square foot. 2609 Lory St is a home located in Fort Bend County with nearby schools including Navarro Middle School, George Junior High School, and B.F. Terry High School.
Ownership History
Date
Name
Owned For
Owner Type
Purchase Details
Closed on
Nov 29, 2011
Sold by
Tubb Charles Wade
Bought by
Tubb Stella A
Current Estimated Value
Purchase Details
Closed on
Mar 5, 2004
Sold by
Holloway Mark and Holloway Katherine G
Bought by
Tubb Charles W and Tubb Stella G
Home Financials for this Owner
Home Financials are based on the most recent Mortgage that was taken out on this home.
Original Mortgage
$154,000
Outstanding Balance
$71,822
Interest Rate
5.64%
Mortgage Type
Seller Take Back
Estimated Equity
$308,646
Purchase Details
Closed on
Dec 28, 1995
Sold by
The First National Bank Of Rosenberg
Bought by
Holloway Mark W and Holloway Katherine G
Purchase Details
Closed on
Apr 29, 1988
Sold by
Zwahr George Eta
Bought by
Tubb Stella A
Create a Home Valuation Report for This Property
The Home Valuation Report is an in-depth analysis detailing your home's value as well as a comparison with similar homes in the area
Home Values in the Area
Average Home Value in this Area
Purchase History
| Date | Buyer | Sale Price | Title Company |
|---|---|---|---|
| Tubb Stella A | -- | None Available | |
| Tubb Charles W | -- | -- | |
| Tubb Stella A | -- | -- | |
| Holloway Mark W | -- | -- | |
| Tubb Stella A | -- | -- |
Source: Public Records
Mortgage History
| Date | Status | Borrower | Loan Amount |
|---|---|---|---|
| Open | Tubb Stella A | $154,000 |
Source: Public Records
Tax History Compared to Growth
Tax History
| Year | Tax Paid | Tax Assessment Tax Assessment Total Assessment is a certain percentage of the fair market value that is determined by local assessors to be the total taxable value of land and additions on the property. | Land | Improvement |
|---|---|---|---|---|
| 2025 | $1,085 | $275,477 | $40,678 | $335,709 |
| 2024 | $1,085 | $250,434 | -- | $359,039 |
| 2023 | $1,023 | $227,667 | $0 | $369,945 |
| 2022 | $2,369 | $206,970 | $0 | $330,820 |
| 2021 | $3,904 | $188,150 | $40,680 | $147,470 |
| 2020 | $3,992 | $188,120 | $40,680 | $147,440 |
| 2019 | $4,231 | $185,260 | $40,680 | $144,580 |
| 2018 | $4,111 | $177,130 | $40,680 | $136,450 |
| 2017 | $3,759 | $161,030 | $40,680 | $120,350 |
| 2016 | $3,747 | $160,540 | $40,680 | $119,860 |
| 2015 | $3,261 | $161,520 | $40,680 | $120,840 |
| 2014 | $3,513 | $164,580 | $40,680 | $123,900 |
Source: Public Records
Map
Nearby Homes
- 2635 Sequoia Ln
- 2211 Hackberry Bank Ln
- 3219 Creole Bay Ln
- 2500 Parkway Ave
- 3604 Rychlik Dr
- 2217 Bernie Ave
- 2002 Austin St
- 2126 Ripple Creek Dr
- 2808 Chupik St
- 2417 4th St
- 3608 Avenue R
- 2102 Mons Ave
- 1926 Klauke Ct
- 2705 Parrott Ave
- 2717 Parrott Ave
- 2601 3rd St
- 3433 Avenue P
- 1921 Ripple Creek Dr
- 1803 Jones St
- 1711 Klauke St