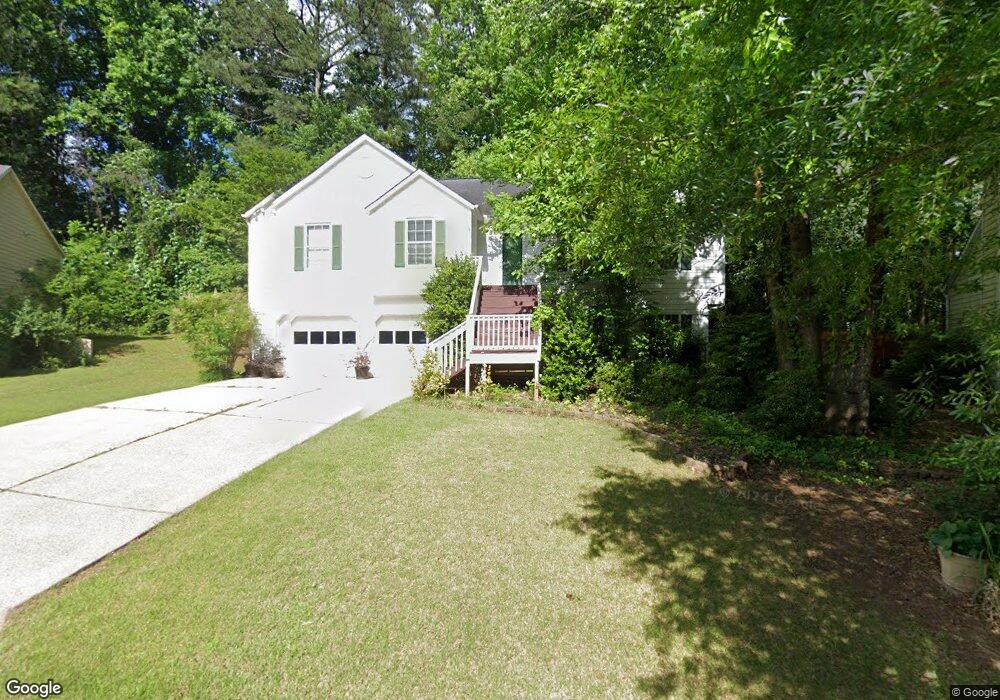
2609 Marleigh Farm Rd NW Kennesaw, GA 30152
Estimated Value: $370,000 - $388,000
3
Beds
3
Baths
1,472
Sq Ft
$257/Sq Ft
Est. Value
About This Home
This home is located at 2609 Marleigh Farm Rd NW, Kennesaw, GA 30152 and is currently estimated at $378,792, approximately $257 per square foot. 2609 Marleigh Farm Rd NW is a home located in Cobb County with nearby schools including Lewis Elementary School, Mcclure Middle School, and Allatoona High School.
Ownership History
Date
Name
Owned For
Owner Type
Purchase Details
Closed on
Sep 29, 2006
Sold by
Ridings Jp and Ridings Angela S
Bought by
Ulloa Alberto I and Ulloa Luis A
Current Estimated Value
Home Financials for this Owner
Home Financials are based on the most recent Mortgage that was taken out on this home.
Original Mortgage
$170,300
Outstanding Balance
$101,040
Interest Rate
6.45%
Mortgage Type
New Conventional
Estimated Equity
$277,752
Purchase Details
Closed on
Oct 21, 1994
Sold by
Naughton Curt E Michelle A
Bought by
Ridings J P Angela S
Home Financials for this Owner
Home Financials are based on the most recent Mortgage that was taken out on this home.
Original Mortgage
$93,000
Interest Rate
8%
Purchase Details
Closed on
Sep 27, 1993
Sold by
Columbia Homes
Bought by
Naughton Curt E Michelle
Home Financials for this Owner
Home Financials are based on the most recent Mortgage that was taken out on this home.
Original Mortgage
$100,785
Interest Rate
6.99%
Mortgage Type
FHA
Create a Home Valuation Report for This Property
The Home Valuation Report is an in-depth analysis detailing your home's value as well as a comparison with similar homes in the area
Home Values in the Area
Average Home Value in this Area
Purchase History
| Date | Buyer | Sale Price | Title Company |
|---|---|---|---|
| Ulloa Alberto I | $179,300 | -- | |
| Ridings J P Angela S | $107,000 | -- | |
| Naughton Curt E Michelle | $102,500 | -- |
Source: Public Records
Mortgage History
| Date | Status | Borrower | Loan Amount |
|---|---|---|---|
| Open | Ulloa Alberto I | $170,300 | |
| Previous Owner | Ridings J P Angela S | $93,000 | |
| Previous Owner | Naughton Curt E Michelle | $100,785 |
Source: Public Records
Tax History Compared to Growth
Tax History
| Year | Tax Paid | Tax Assessment Tax Assessment Total Assessment is a certain percentage of the fair market value that is determined by local assessors to be the total taxable value of land and additions on the property. | Land | Improvement |
|---|---|---|---|---|
| 2025 | $3,364 | $141,012 | $32,000 | $109,012 |
| 2024 | $3,347 | $140,128 | $18,000 | $122,128 |
| 2023 | $2,805 | $140,128 | $18,000 | $122,128 |
| 2022 | $2,370 | $94,284 | $18,000 | $76,284 |
| 2021 | $2,370 | $94,284 | $18,000 | $76,284 |
| 2020 | $2,058 | $80,032 | $18,000 | $62,032 |
| 2019 | $2,058 | $80,032 | $18,000 | $62,032 |
| 2018 | $1,877 | $71,788 | $18,000 | $53,788 |
| 2017 | $1,785 | $71,788 | $18,000 | $53,788 |
| 2016 | $1,494 | $60,872 | $10,000 | $50,872 |
| 2015 | $1,533 | $60,872 | $10,000 | $50,872 |
| 2014 | $1,342 | $53,996 | $0 | $0 |
Source: Public Records
Map
Nearby Homes
- 5615 Meadowstone Walk
- 3348 Owens Brook Way NW
- 3286 Standing Peachtree Trail NW
- 3572 Plum Creek Trail NW Unit 3
- 3283 Standing Peachtree Trail NW
- 2511 Owens Landing Trail NW
- 0 Jim Ownes Rd
- 2507 Blaydon Pointe NW
- 2311 Ellie Way
- 3616 Hollyhock Way NW
- 3415 Kenyon Creek Dr NW
- 3447 Stonewall Dr NW
- 3225 Danlow Ct
- 3208 Danlow Ct
- 2634 Kaley Ct NW
- 3025 Kaley Dr NW
- 2611 Marleigh Farm Rd NW
- 2611 Marleigh Farm Rd NW
- 2611 Marleigh Farm Rd NW Unit GAA0207
- 2611 Marleigh Farm Rd NW Unit Gaa020
- 2607 Marleigh Farm Rd NW
- 5604 Meadowstone Walk
- 3351 Owens Brook Way NW
- 2613 Marleigh Farm Rd NW
- 2605 Marleigh Farm Rd NW
- 3217 Stonewall Dr NW
- 2600 Marleigh Farm Rd NW Unit 1
- 2602 Marleigh Farm Rd NW Unit 1
- 0 Marleigh Farm Rd NW Unit 8728952
- 0 Marleigh Farm Rd NW Unit 8671114
- 0 Marleigh Farm Rd NW Unit 8440571
- 0 Marleigh Farm Rd NW Unit 8387921
- 0 Marleigh Farm Rd NW Unit 8365822
- 0 Marleigh Farm Rd NW Unit 8314283
- 0 Marleigh Farm Rd NW Unit 7528642
- 0 Marleigh Farm Rd NW Unit 8638760