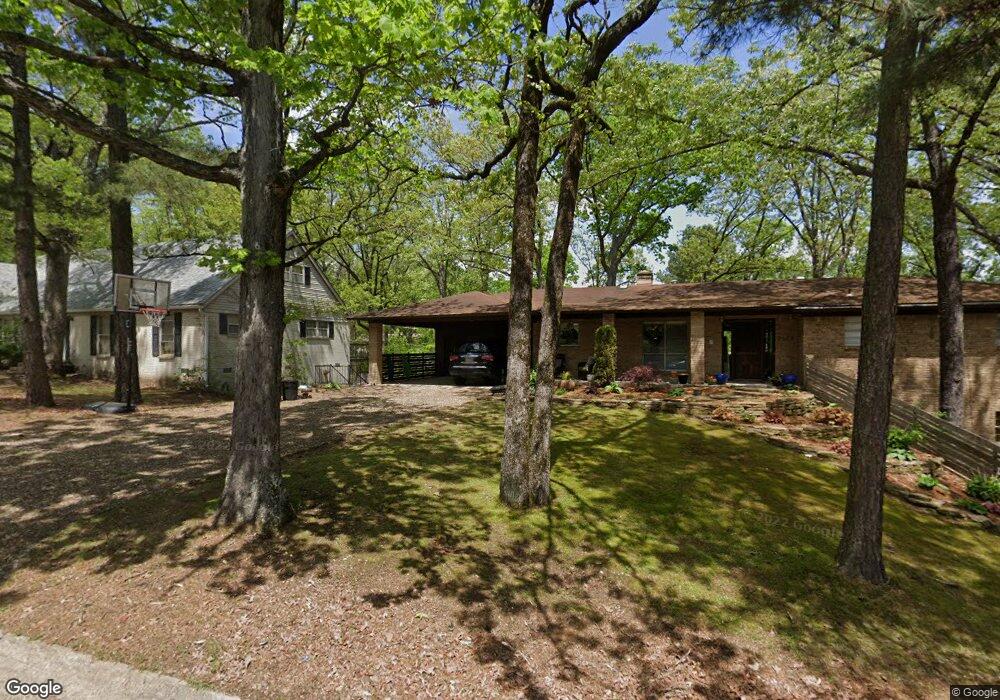
2609 S Hills Ct North Little Rock, AR 72116
Lakewood NeighborhoodEstimated Value: $312,637 - $354,000
--
Bed
3
Baths
3,576
Sq Ft
$95/Sq Ft
Est. Value
About This Home
This home is located at 2609 S Hills Ct, North Little Rock, AR 72116 and is currently estimated at $338,159, approximately $94 per square foot. 2609 S Hills Ct is a home located in Pulaski County with nearby schools including Lakewood Elementary School, North Little Rock Middle School 6th Grade Campus, and North Little Rock High School.
Ownership History
Date
Name
Owned For
Owner Type
Purchase Details
Closed on
Feb 8, 2021
Sold by
Pownall Andrew J and Bailey Amanda M
Bought by
Pownall Andrew J and Bailey Amanda M
Current Estimated Value
Home Financials for this Owner
Home Financials are based on the most recent Mortgage that was taken out on this home.
Original Mortgage
$180,000
Outstanding Balance
$131,041
Interest Rate
2.16%
Mortgage Type
New Conventional
Estimated Equity
$207,118
Purchase Details
Closed on
Jan 3, 2017
Sold by
Pownall John R and Pownall Janis Marie
Bought by
Pownall Andrew J
Home Financials for this Owner
Home Financials are based on the most recent Mortgage that was taken out on this home.
Original Mortgage
$159,200
Interest Rate
4.03%
Mortgage Type
New Conventional
Purchase Details
Closed on
Jul 25, 1997
Sold by
Pownall Barbara Elaine Boone
Bought by
Pownall Barbara B and Pownall John R
Create a Home Valuation Report for This Property
The Home Valuation Report is an in-depth analysis detailing your home's value as well as a comparison with similar homes in the area
Home Values in the Area
Average Home Value in this Area
Purchase History
| Date | Buyer | Sale Price | Title Company |
|---|---|---|---|
| Pownall Andrew J | -- | Standard Abstract & Title | |
| Pownall Andrew J | $199,000 | Standard Abstract & Title Co | |
| Pownall Barbara B | -- | -- |
Source: Public Records
Mortgage History
| Date | Status | Borrower | Loan Amount |
|---|---|---|---|
| Open | Pownall Andrew J | $180,000 | |
| Previous Owner | Pownall Andrew J | $159,200 |
Source: Public Records
Tax History Compared to Growth
Tax History
| Year | Tax Paid | Tax Assessment Tax Assessment Total Assessment is a certain percentage of the fair market value that is determined by local assessors to be the total taxable value of land and additions on the property. | Land | Improvement |
|---|---|---|---|---|
| 2025 | $3,690 | $55,246 | $8,400 | $46,846 |
| 2024 | $3,690 | $55,246 | $8,400 | $46,846 |
| 2023 | $3,690 | $55,246 | $8,400 | $46,846 |
| 2022 | $3,877 | $55,246 | $8,400 | $46,846 |
| 2021 | $3,412 | $48,330 | $5,400 | $42,930 |
| 2020 | $3,228 | $48,330 | $5,400 | $42,930 |
| 2019 | $3,404 | $48,330 | $5,400 | $42,930 |
| 2018 | $3,401 | $48,330 | $5,400 | $42,930 |
| 2017 | $3,051 | $48,330 | $5,400 | $42,930 |
| 2016 | $3,141 | $48,050 | $6,040 | $42,010 |
| 2015 | $3,015 | $45,141 | $6,040 | $39,101 |
| 2014 | $3,015 | $41,381 | $6,040 | $35,341 |
Source: Public Records
Map
Nearby Homes
- 5804 N Hills Blvd
- 3111 Lakeview Rd
- 2701 Donaghey Dr
- 3605 N Hills Blvd
- 3801 Pope Ave
- 2 Lakewood Park Dr
- 3808 Pope Ave
- 31 E Lake Dr
- 3109 Donaghey Dr
- 3108 Cleburne Place
- 36 Desoto Cir
- 322 Belmont Dr
- 38 Desoto Cir
- 3 Pine Tree Point
- 4105 N Hills Blvd
- 163 Sheridan Rd
- 18 Pine Tree Loop
- 130 Sheridan Rd
- 1324 Skyline Dr
- 4100 Lochridge Rd
- 2605 S Hills Ct
- 2611 S Hills Ct
- 2620 Lakeview Rd
- 2601 S Hills Ct
- 2624 Lakeview Rd
- 2616 Lakeview Rd
- 2612 S Hill Ct
- 2600 S Hill Ct
- 0 S Hill Ct
- 2600 S Hills Ct
- 2612 S Hills Ct
- 2612 Lakeview Rd
- 2604 S Hills Ct
- 2608 S Hills Ct
- 2608 Lakeview Rd
- 3400 Sevier Dr
- 2604 Lakeview Rd
- 2705 Lakeview Rd
- 25 Shore Point Rd
- 24 Shore Point Rd