Estimated Value: $99,226 - $158,000
3
Beds
1
Bath
1,000
Sq Ft
$135/Sq Ft
Est. Value
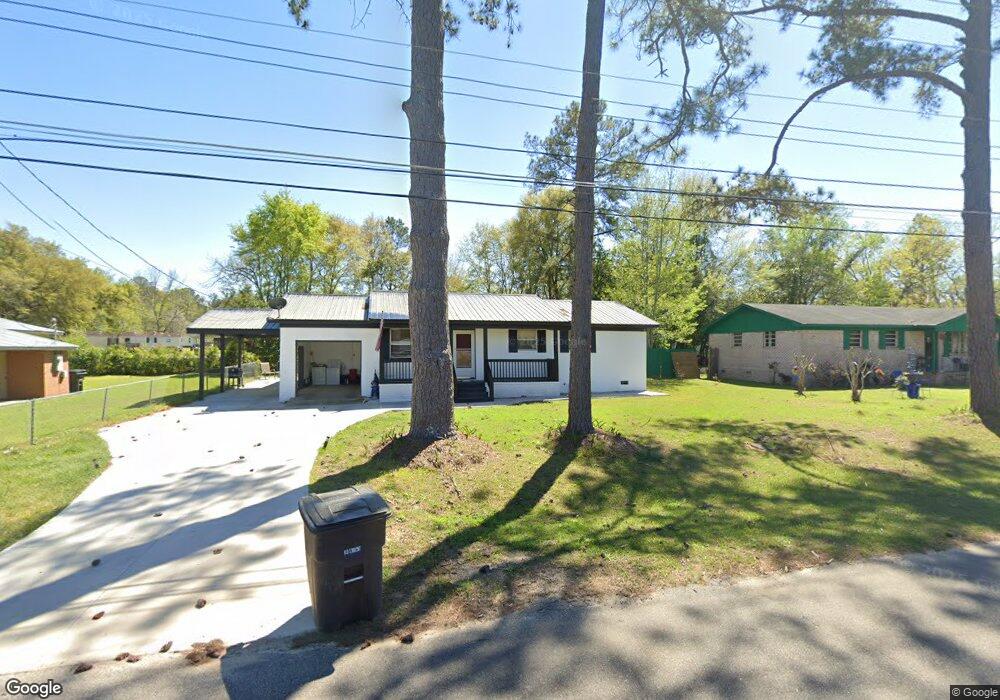
About This Home
This home is located at 261 13th Ave SW, Cairo, GA 39828 and is currently estimated at $135,057, approximately $135 per square foot. 261 13th Ave SW is a home located in Grady County with nearby schools including Cairo High School.
Ownership History
Date
Name
Owned For
Owner Type
Purchase Details
Closed on
Nov 28, 2022
Sold by
Bryant Felicia
Bought by
Barnhill Khadija
Current Estimated Value
Purchase Details
Closed on
Oct 27, 2009
Sold by
Parker Vickie F
Bought by
Bryant Felicia D
Home Financials for this Owner
Home Financials are based on the most recent Mortgage that was taken out on this home.
Original Mortgage
$74,460
Interest Rate
4.93%
Mortgage Type
New Conventional
Purchase Details
Closed on
Oct 14, 2009
Sold by
Parker Brenda
Bought by
Parker Vickie F
Home Financials for this Owner
Home Financials are based on the most recent Mortgage that was taken out on this home.
Original Mortgage
$74,460
Interest Rate
4.93%
Mortgage Type
New Conventional
Purchase Details
Closed on
Oct 11, 2009
Sold by
Schafer Tracy
Bought by
Parker Vickie F
Home Financials for this Owner
Home Financials are based on the most recent Mortgage that was taken out on this home.
Original Mortgage
$74,460
Interest Rate
4.93%
Mortgage Type
New Conventional
Purchase Details
Closed on
Dec 9, 1974
Bought by
Parker Marvin L
Create a Home Valuation Report for This Property
The Home Valuation Report is an in-depth analysis detailing your home's value as well as a comparison with similar homes in the area
Purchase History
| Date | Buyer | Sale Price | Title Company |
|---|---|---|---|
| Barnhill Khadija | -- | -- | |
| Bryant Felicia D | $73,000 | -- | |
| Parker Vickie F | -- | -- | |
| Parker Vickie F | -- | -- | |
| Parker Vickie F | -- | -- | |
| Parker Vickie F | -- | -- | |
| Parker Marvin L | -- | -- |
Source: Public Records
Mortgage History
| Date | Status | Borrower | Loan Amount |
|---|---|---|---|
| Previous Owner | Bryant Felicia D | $74,460 |
Source: Public Records
Tax History
| Year | Tax Paid | Tax Assessment Tax Assessment Total Assessment is a certain percentage of the fair market value that is determined by local assessors to be the total taxable value of land and additions on the property. | Land | Improvement |
|---|---|---|---|---|
| 2024 | $1,261 | $43,518 | $4,000 | $39,518 |
| 2023 | $840 | $24,359 | $2,800 | $21,559 |
| 2022 | $876 | $24,359 | $2,800 | $21,559 |
| 2021 | $879 | $24,359 | $2,800 | $21,559 |
| 2020 | $881 | $24,359 | $2,800 | $21,559 |
| 2019 | $881 | $24,359 | $2,800 | $21,559 |
| 2018 | $838 | $24,359 | $2,800 | $21,559 |
| 2017 | $806 | $24,359 | $2,800 | $21,559 |
| 2016 | $690 | $20,615 | $2,800 | $17,815 |
| 2015 | $683 | $20,615 | $2,800 | $17,815 |
| 2014 | $684 | $20,615 | $2,800 | $17,815 |
| 2013 | -- | $17,893 | $2,800 | $15,093 |
Source: Public Records
Map
Nearby Homes
- 117 SW Pine Cirlce
- 112 Pine Cir SW
- 1193 S Broad St
- 460 2nd St SW
- 306 Midland Place
- 130 17th Ave SE
- 112 Cakebread Dr
- 0 Georgia 111
- 198 Oakdale Rd SE
- 1406 Platt Ave
- 1405 Platt Ave
- 320 8th St SW
- 580 5th St SE
- 530 6th Ave SE
- 309 3rd St SE
- 530 6th St
- 00 Hwy 111 South Tract 1
- X 1st St
- 0 1st St
- 0 111 Hwy Unit 396477
- 271 13th Ave SW
- 251 13th Ave SW
- 281 13th Ave SW
- 241 13th Ave SW
- 244 13th Ave SW
- 291 13th Ave SW
- 231 13th Ave SW
- 232 13th Ave SW
- 270 13th Ave SW
- 235 12th Ave SW
- 00 Ramble Cir SW
- 287 12th Ave SW
- 1230 Ramble Cir
- 221 13th Ave SW
- 1235 Ramble Cir
- 297 12th Ave SW
- 1228 Ramble Cir
- 300 13th Ave SW
- 220 13th Ave SW
- 236 12th Ave SW
Your Personal Tour Guide
Ask me questions while you tour the home.