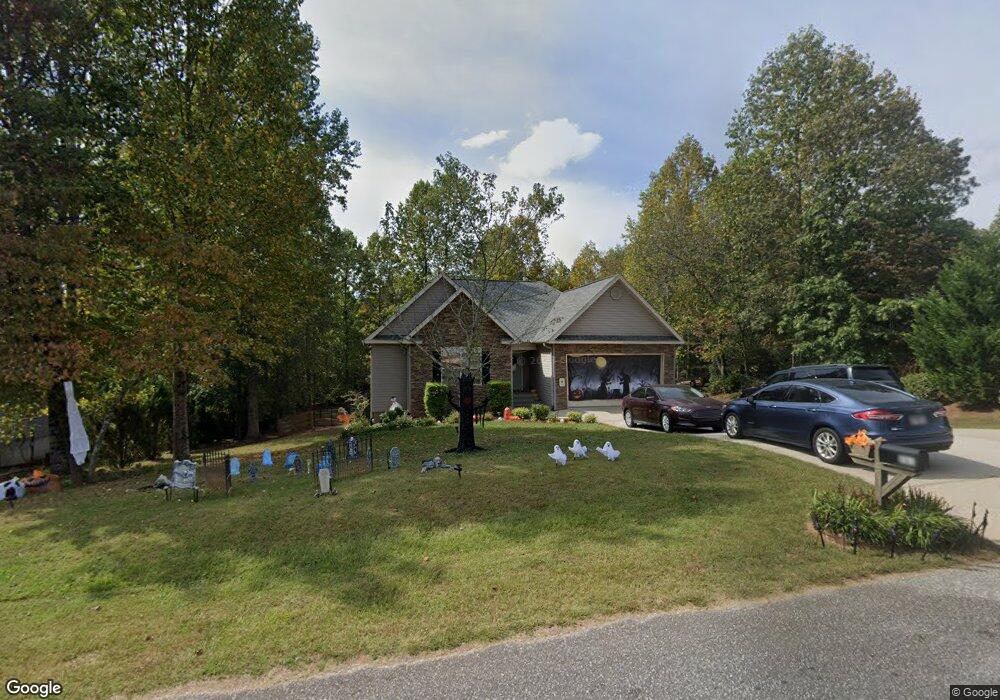
261 Black Hawk Ln Unit 17 Clarkesville, GA 30523
Estimated Value: $429,000 - $574,000
3
Beds
4
Baths
3,644
Sq Ft
$133/Sq Ft
Est. Value
About This Home
This home is located at 261 Black Hawk Ln Unit 17, Clarkesville, GA 30523 and is currently estimated at $485,465, approximately $133 per square foot. 261 Black Hawk Ln Unit 17 is a home located in Habersham County with nearby schools including Fairview Elementary School, North Habersham Middle School, and Habersham Success Academy.
Ownership History
Date
Name
Owned For
Owner Type
Purchase Details
Closed on
Apr 29, 2022
Sold by
Etheridge Nicholas
Bought by
Clark Delmar J
Current Estimated Value
Purchase Details
Closed on
Mar 29, 2018
Sold by
Rhoades Rodger M
Bought by
Etheridge Nicholas and Etheridge Oliva
Home Financials for this Owner
Home Financials are based on the most recent Mortgage that was taken out on this home.
Original Mortgage
$231,321
Interest Rate
4.43%
Mortgage Type
VA
Purchase Details
Closed on
Jul 1, 2007
Sold by
Not Provided
Bought by
Rhoades Rodger M and Rhoades Kelly L
Home Financials for this Owner
Home Financials are based on the most recent Mortgage that was taken out on this home.
Original Mortgage
$168,200
Interest Rate
5.88%
Mortgage Type
New Conventional
Purchase Details
Closed on
Aug 1, 2006
Sold by
Not Provided
Bought by
Rhoades Rodger M and Rhoades Kelly L
Purchase Details
Closed on
Jan 1, 2006
Sold by
Not Provided
Bought by
Rhoades Rodger M and Rhoades Kelly L
Create a Home Valuation Report for This Property
The Home Valuation Report is an in-depth analysis detailing your home's value as well as a comparison with similar homes in the area
Home Values in the Area
Average Home Value in this Area
Purchase History
| Date | Buyer | Sale Price | Title Company |
|---|---|---|---|
| Clark Delmar J | $385,000 | -- | |
| Etheridge Nicholas | $225,900 | -- | |
| Rhoades Rodger M | $186,900 | -- | |
| Rhoades Rodger M | $204,400 | -- | |
| Rhoades Rodger M | $506,000 | -- |
Source: Public Records
Mortgage History
| Date | Status | Borrower | Loan Amount |
|---|---|---|---|
| Previous Owner | Etheridge Nicholas | $231,321 | |
| Previous Owner | Rhoades Rodger M | $168,200 |
Source: Public Records
Tax History Compared to Growth
Tax History
| Year | Tax Paid | Tax Assessment Tax Assessment Total Assessment is a certain percentage of the fair market value that is determined by local assessors to be the total taxable value of land and additions on the property. | Land | Improvement |
|---|---|---|---|---|
| 2025 | $1,826 | $221,382 | $16,000 | $205,382 |
| 2024 | -- | $190,368 | $16,000 | $174,368 |
| 2023 | $1,657 | $154,000 | $15,400 | $138,600 |
| 2022 | $3,335 | $127,904 | $16,000 | $111,904 |
| 2021 | $2,692 | $103,736 | $10,000 | $93,736 |
| 2020 | $2,431 | $90,368 | $10,000 | $80,368 |
| 2019 | $2,433 | $90,368 | $10,000 | $80,368 |
| 2018 | $2,452 | $91,784 | $10,000 | $81,784 |
| 2017 | $2,239 | $85,308 | $10,000 | $75,308 |
| 2016 | $2,053 | $201,870 | $8,000 | $72,748 |
| 2015 | $1,978 | $196,870 | $6,000 | $72,748 |
| 2014 | $1,953 | $190,950 | $6,000 | $70,380 |
| 2013 | -- | $82,416 | $6,000 | $76,416 |
Source: Public Records
Map
Nearby Homes
- 3039 Georgia 17
- 111 On Golden Pond Ln
- 4855 Georgia 115
- 355 Zeb Bryson Rd
- 4822 Georgia 115
- 0 Highway 115 Unit 10643669
- 350 Kitty Hawk Ln
- 166 Poplar Springs Dr
- 104 Brando Trail
- 271 Panacea Ln
- 715 Ridge Rd
- 147 Crest Winds Dr
- 124 Signing Tree Ln
- 219 Signing Tree Ln
- 555 Highway 197 N
- 1.0 ACRES-B Bar Rod Rd
- 1955 Alec Mountain Rd
- 0 Sutton Mill Rd Unit 10644026
- 385 Amys Rd
- 206 Shoals Way
- 261 Black Hawk Ln
- 243 Black Hawk Ln
- 295 Black Hawk Ln
- 295 Black Hawk Ln Unit 18
- 292 Black Hawk Ln
- 0 Hearth Stone Dr Unit 3241687
- 0 Hearth Stone Dr Unit 8605458
- 108 Hearth Stone Dr
- 159 Hearth Stone Dr
- 330 Black Hawk Ln
- 331 Black Hawk Ln Unit 21
- 331 Black Hawk Ln
- 215 Black Hawk Ln
- 395 Black Hawk Ln
- 153 Hearth Stone Dr
- 107 Hearth Stone Dr
- 426 Applewood Ct
- 165 Hearth Stone Dr
- 214 Black Hawk Ln
- 438 Applewood Ct