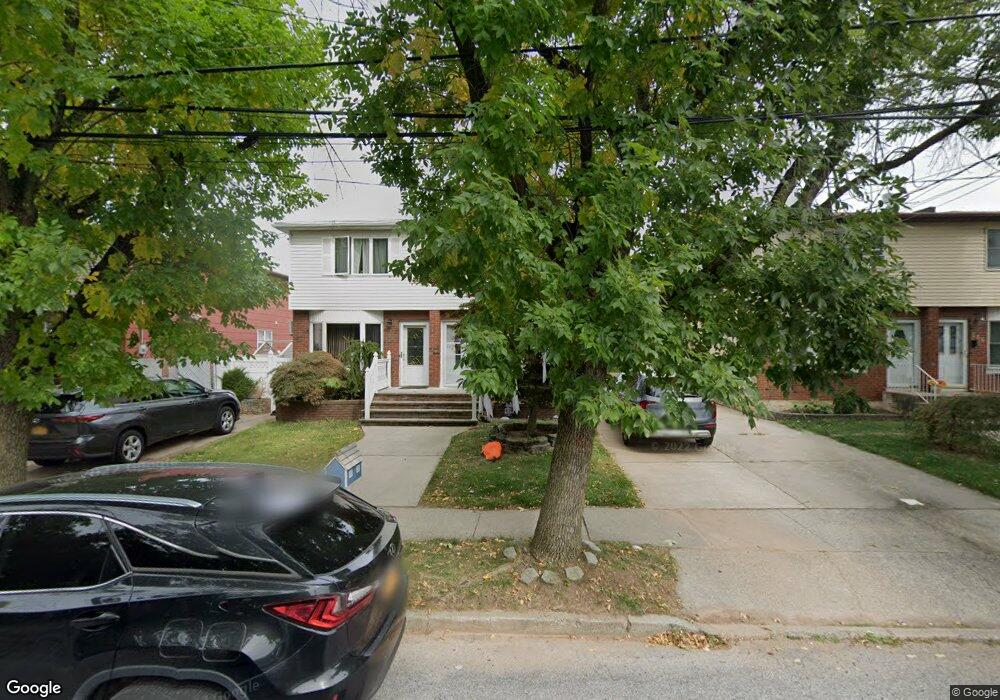
261 Corbin Ave Staten Island, NY 10308
Great Kills NeighborhoodEstimated Value: $685,000 - $761,000
3
Beds
2
Baths
1,350
Sq Ft
$525/Sq Ft
Est. Value
About This Home
This home is located at 261 Corbin Ave, Staten Island, NY 10308 and is currently estimated at $709,059, approximately $525 per square foot. 261 Corbin Ave is a home located in Richmond County with nearby schools including P.S. 32 The Gifford School, Myra S. Barnes Intermediate School 24, and Susan E Wagner High School.
Ownership History
Date
Name
Owned For
Owner Type
Purchase Details
Closed on
Oct 2, 2020
Sold by
Bongiorno Scott and Triolo Donna M
Bought by
Ditre Joseph and Ditre Kathleen
Current Estimated Value
Home Financials for this Owner
Home Financials are based on the most recent Mortgage that was taken out on this home.
Original Mortgage
$530,117
Outstanding Balance
$471,511
Interest Rate
2.9%
Mortgage Type
FHA
Estimated Equity
$237,548
Purchase Details
Closed on
Jan 26, 2005
Sold by
Funari Joseph and Funari Josephine
Bought by
Portelli Anthony and Portelli Rosaria
Home Financials for this Owner
Home Financials are based on the most recent Mortgage that was taken out on this home.
Original Mortgage
$328,000
Interest Rate
5.67%
Mortgage Type
Fannie Mae Freddie Mac
Purchase Details
Closed on
Nov 14, 2001
Sold by
Larosa Nicholas
Bought by
Funari Joseph and Funari Josephine
Home Financials for this Owner
Home Financials are based on the most recent Mortgage that was taken out on this home.
Original Mortgage
$208,000
Interest Rate
7.04%
Create a Home Valuation Report for This Property
The Home Valuation Report is an in-depth analysis detailing your home's value as well as a comparison with similar homes in the area
Home Values in the Area
Average Home Value in this Area
Purchase History
| Date | Buyer | Sale Price | Title Company |
|---|---|---|---|
| Ditre Joseph | $540,000 | Gem Abstract Corp | |
| Portelli Anthony | $410,000 | Regal Title Agency | |
| Funari Joseph | -- | Fidelity National Title Ins |
Source: Public Records
Mortgage History
| Date | Status | Borrower | Loan Amount |
|---|---|---|---|
| Open | Ditre Joseph | $530,117 | |
| Previous Owner | Portelli Anthony | $328,000 | |
| Previous Owner | Funari Joseph | $208,000 |
Source: Public Records
Tax History Compared to Growth
Tax History
| Year | Tax Paid | Tax Assessment Tax Assessment Total Assessment is a certain percentage of the fair market value that is determined by local assessors to be the total taxable value of land and additions on the property. | Land | Improvement |
|---|---|---|---|---|
| 2025 | $5,914 | $43,560 | $5,682 | $37,878 |
| 2024 | $5,926 | $37,200 | $6,368 | $30,832 |
| 2023 | $5,629 | $29,117 | $5,944 | $23,173 |
| 2022 | $5,526 | $37,260 | $7,680 | $29,580 |
| 2021 | $5,622 | $33,240 | $7,680 | $25,560 |
| 2020 | $5,389 | $31,200 | $7,680 | $23,520 |
| 2019 | $5,084 | $28,140 | $7,680 | $20,460 |
| 2018 | $4,649 | $24,264 | $5,871 | $18,393 |
| 2017 | $4,647 | $24,264 | $7,669 | $16,595 |
| 2016 | $4,380 | $23,460 | $7,680 | $15,780 |
| 2015 | $3,806 | $22,380 | $6,420 | $15,960 |
| 2014 | $3,806 | $21,420 | $6,420 | $15,000 |
Source: Public Records
Map
Nearby Homes
- 4 Country Woods Ln
- 298 Tanglewood Dr
- 43 Country Woods Ln
- 305 Corbin Ave
- 19 Nutwood Ct
- 47 Jumel St
- 52 Barlow Ave
- 160 Tanglewood Dr
- 98 Kennington St
- 62 Daleham St
- 12 Troy St
- 106 Redwood Ave
- 25 Fuller Ct Unit A
- 132 Elkhart St
- 15 Fuller Ct Unit A
- 168 Cotter Ave
- 38 Troy St
- 40 Troy St
- 168 Leverett Ave
- 8 Croft Ct
- 257 Corbin Ave
- 263 Corbin Ave
- 255 Corbin Ave
- 267 Corbin Ave
- 269 Corbin Ave
- 251 Corbin Ave
- 38 Sandalwood Dr
- 42 Sandalwood Dr
- 273 Corbin Ave
- 36 Sandalwood Dr
- 44 Sandalwood Dr
- 34 Sandalwood Dr
- 46 Sandalwood Dr
- 32 Sandalwood Dr
- 48 Sandalwood Dr
- 275 Corbin Ave
- 30 Sandalwood Dr
- 50 Sandalwood Dr
- 247 Corbin Ave
- 28 Sandalwood Dr