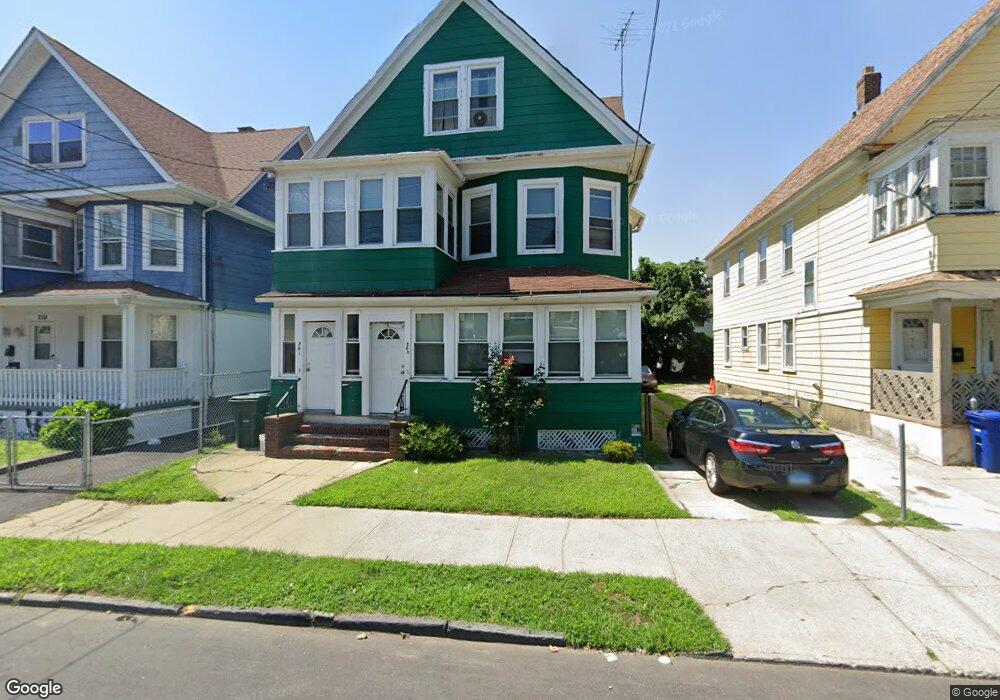
261 Davenport St Unit 263 Bridgeport, CT 06607
East End NeighborhoodEstimated Value: $317,000 - $513,000
4
Beds
2
Baths
3,131
Sq Ft
$127/Sq Ft
Est. Value
About This Home
This home is located at 261 Davenport St Unit 263, Bridgeport, CT 06607 and is currently estimated at $397,549, approximately $126 per square foot. 261 Davenport St Unit 263 is a home located in Fairfield County with nearby schools including Jettie S. Tisdale School, Harding High School, and Capital Prep Harbor Upper School.
Ownership History
Date
Name
Owned For
Owner Type
Purchase Details
Closed on
Oct 7, 1994
Sold by
Delvecchio Dorothy R and Roberto Marie V
Bought by
Nubin Hercules
Current Estimated Value
Home Financials for this Owner
Home Financials are based on the most recent Mortgage that was taken out on this home.
Original Mortgage
$40,740
Interest Rate
8.55%
Mortgage Type
Unknown
Create a Home Valuation Report for This Property
The Home Valuation Report is an in-depth analysis detailing your home's value as well as a comparison with similar homes in the area
Home Values in the Area
Average Home Value in this Area
Purchase History
| Date | Buyer | Sale Price | Title Company |
|---|---|---|---|
| Nubin Hercules | $42,000 | -- | |
| Nubin Hercules | $42,000 | -- |
Source: Public Records
Mortgage History
| Date | Status | Borrower | Loan Amount |
|---|---|---|---|
| Open | Nubin Hercules | $181,722 | |
| Closed | Nubin Hercules | $118,560 | |
| Closed | Nubin Hercules | $40,740 |
Source: Public Records
Tax History Compared to Growth
Tax History
| Year | Tax Paid | Tax Assessment Tax Assessment Total Assessment is a certain percentage of the fair market value that is determined by local assessors to be the total taxable value of land and additions on the property. | Land | Improvement |
|---|---|---|---|---|
| 2025 | $6,704 | $154,300 | $30,720 | $123,580 |
| 2024 | $6,704 | $154,300 | $30,720 | $123,580 |
| 2023 | $6,704 | $154,300 | $30,720 | $123,580 |
| 2022 | $6,704 | $154,300 | $30,720 | $123,580 |
| 2021 | $6,704 | $154,300 | $30,720 | $123,580 |
| 2020 | $6,413 | $118,790 | $17,190 | $101,600 |
| 2019 | $6,413 | $118,790 | $17,190 | $101,600 |
| 2018 | $6,459 | $118,790 | $17,190 | $101,600 |
| 2017 | $6,459 | $118,790 | $17,190 | $101,600 |
| 2016 | $6,459 | $118,790 | $17,190 | $101,600 |
| 2015 | $7,102 | $168,300 | $29,460 | $138,840 |
| 2014 | $7,102 | $168,300 | $29,460 | $138,840 |
Source: Public Records
Map
Nearby Homes
- 179 Read St
- 1034 Connecticut Ave
- 68 Edwin St Unit 70
- 1440 Stratford Ave
- 785 Connecticut Ave Unit 2
- 580 Wilmot Ave Unit 2
- 610 Wilmot Ave Unit 4
- 591 Wilmot Ave Unit 3
- 363 Carroll Ave Unit 365
- 306 Carroll Ave
- 566 Wilmot Ave Unit 4
- 408 Union Ave
- 819 Connecticut Ave Unit 6
- 49 Bunnell St Unit 51
- 221 Bunnell St
- 54 6th St
- 643 Newfield Ave Unit 645
- 228 Holly St Unit 230
- 247 6th St
- 40 5th St
- 257 Davenport St Unit 259
- 275 Davenport St Unit 277
- 255 Davenport St Unit 3
- 255 Davenport St Unit 1st
- 255 Davenport St
- 253 Davenport St Unit 255
- 253 Davenport St Unit 3rd f
- 253 Davenport St Unit 1st f
- 248 Davenport St Unit 254
- 256 Davenport St Unit 258
- 256 Davenport St Unit 1
- 272 Davenport St Unit 274
- 272 Davenport St Unit 3
- 264 Davenport St Unit 268
- 264 Davenport St Unit 3
- 68 Hewitt St
- 54 Hewitt St
- 280 Davenport St Unit 282
- 283 Davenport St
- 288 Davenport St Unit 290