Estimated Value: $204,000 - $267,000
3
Beds
1
Bath
1,568
Sq Ft
$155/Sq Ft
Est. Value
About This Home
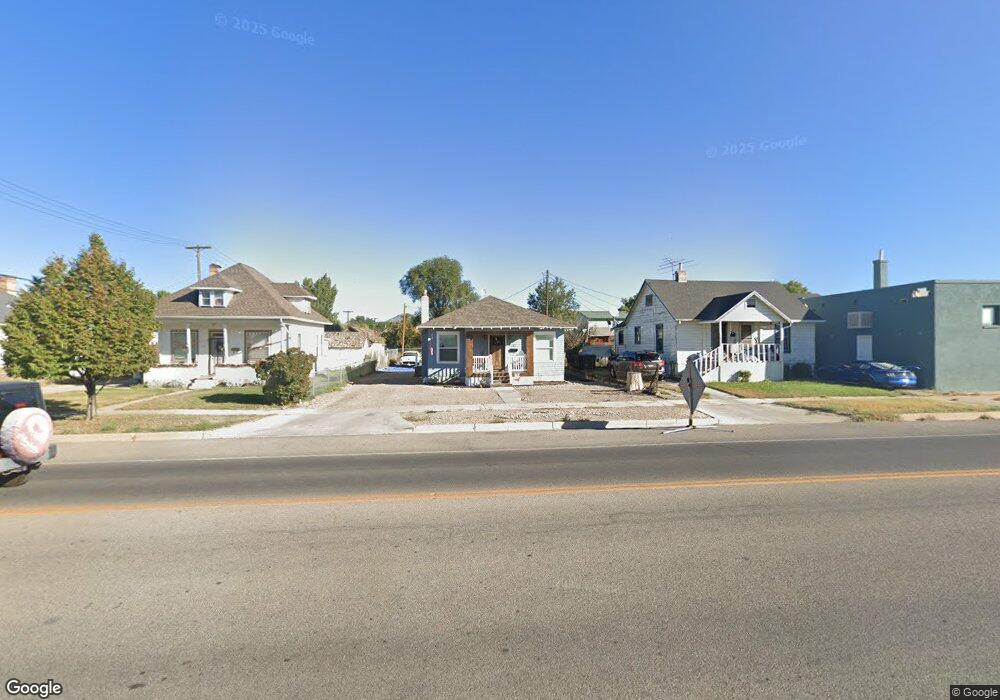
This home is located at 261 E 100 N, Price, UT 84501 and is currently estimated at $243,771, approximately $155 per square foot. 261 E 100 N is a home located in Carbon County with nearby schools including Castle Heights School, Mont Harmon Junior High School, and Carbon High School.
Ownership History
Date
Name
Owned For
Owner Type
Purchase Details
Closed on
Sep 16, 2022
Sold by
Marsing Boyd L and Marsing Marie Kelsey
Bought by
Mcbride Jed A
Current Estimated Value
Home Financials for this Owner
Home Financials are based on the most recent Mortgage that was taken out on this home.
Original Mortgage
$10,097
Outstanding Balance
$9,691
Interest Rate
6.02%
Estimated Equity
$234,080
Purchase Details
Closed on
Sep 22, 2020
Sold by
Alger John L and Alger Shirley J
Bought by
Marsing Boyd L and Marsing Kelsey Marie
Create a Home Valuation Report for This Property
The Home Valuation Report is an in-depth analysis detailing your home's value as well as a comparison with similar homes in the area
Home Values in the Area
Average Home Value in this Area
Purchase History
| Date | Buyer | Sale Price | Title Company |
|---|---|---|---|
| Mcbride Jed A | -- | South Eastern Utah Title | |
| Marsing Boyd L | -- | Professional Title Services |
Source: Public Records
Mortgage History
| Date | Status | Borrower | Loan Amount |
|---|---|---|---|
| Open | Mcbride Jed A | $10,097 | |
| Open | Mcbride Jed A | $225,834 |
Source: Public Records
Tax History Compared to Growth
Tax History
| Year | Tax Paid | Tax Assessment Tax Assessment Total Assessment is a certain percentage of the fair market value that is determined by local assessors to be the total taxable value of land and additions on the property. | Land | Improvement |
|---|---|---|---|---|
| 2025 | $1,260 | $103,695 | $10,908 | $92,787 |
| 2024 | $1,620 | $74,179 | $11,138 | $63,041 |
| 2023 | $1,345 | $65,699 | $8,432 | $57,267 |
| 2022 | $1,024 | $44,883 | $7,010 | $37,874 |
| 2021 | $891 | $60,609 | $10,710 | $49,899 |
| 2020 | $638 | $39,570 | $0 | $0 |
| 2019 | $608 | $39,570 | $0 | $0 |
| 2018 | $444 | $29,480 | $0 | $0 |
| 2017 | $439 | $29,480 | $0 | $0 |
| 2016 | $396 | $29,480 | $0 | $0 |
| 2015 | $396 | $29,480 | $0 | $0 |
| 2014 | $393 | $29,480 | $0 | $0 |
| 2013 | $272 | $20,212 | $0 | $0 |
Source: Public Records
Map
Nearby Homes