261 E 200 N Gunnison, UT 84634
Gunnison NeighborhoodEstimated Value: $377,000 - $600,000
3
Beds
2
Baths
3,264
Sq Ft
$138/Sq Ft
Est. Value
About This Home
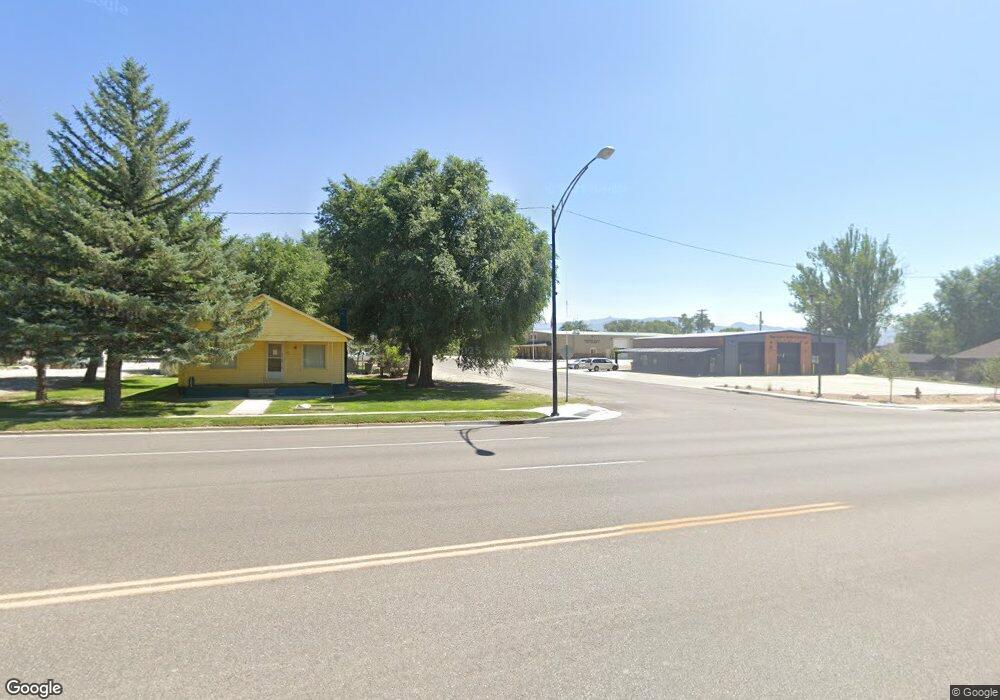
This home is located at 261 E 200 N, Gunnison, UT 84634 and is currently estimated at $450,225, approximately $137 per square foot. 261 E 200 N is a home located in Sanpete County.
Ownership History
Date
Name
Owned For
Owner Type
Purchase Details
Closed on
May 29, 2018
Sold by
Black John M and Black Carolinr F
Bought by
Easton Cox
Current Estimated Value
Home Financials for this Owner
Home Financials are based on the most recent Mortgage that was taken out on this home.
Original Mortgage
$190,800
Outstanding Balance
$163,222
Interest Rate
4.4%
Mortgage Type
New Conventional
Estimated Equity
$287,003
Purchase Details
Closed on
Feb 15, 2012
Sold by
Federal Home Loan Mortgage Corporation
Bought by
Black John M and Black Caroline F
Purchase Details
Closed on
Jul 13, 2009
Sold by
Ball Devin and Ball Sarah
Bought by
Ball Devin and Ball Ronald B
Create a Home Valuation Report for This Property
The Home Valuation Report is an in-depth analysis detailing your home's value as well as a comparison with similar homes in the area
Home Values in the Area
Average Home Value in this Area
Purchase History
| Date | Buyer | Sale Price | Title Company |
|---|---|---|---|
| Easton Cox | $238,500 | D Land Title-Manti | |
| Black John M | -- | -- | |
| Ball Devin | -- | -- |
Source: Public Records
Mortgage History
| Date | Status | Borrower | Loan Amount |
|---|---|---|---|
| Open | Easton Cox | $190,800 |
Source: Public Records
Tax History
| Year | Tax Paid | Tax Assessment Tax Assessment Total Assessment is a certain percentage of the fair market value that is determined by local assessors to be the total taxable value of land and additions on the property. | Land | Improvement |
|---|---|---|---|---|
| 2025 | $2,277 | $215,334 | $0 | $0 |
| 2024 | $2,284 | $206,922 | $0 | $0 |
| 2023 | $2,272 | $192,156 | $0 | $0 |
| 2022 | $2,197 | $171,568 | $0 | $0 |
| 2021 | $2,064 | $139,443 | $0 | $0 |
| 2020 | $1,923 | $121,827 | $0 | $0 |
| 2019 | $1,829 | $113,011 | $0 | $0 |
| 2018 | $1,658 | $176,967 | $19,800 | $157,167 |
| 2017 | $1,573 | $97,332 | $0 | $0 |
| 2016 | $1,490 | $92,226 | $0 | $0 |
| 2015 | $1,493 | $92,226 | $0 | $0 |
| 2014 | $1,469 | $92,226 | $0 | $0 |
| 2013 | $1,471 | $92,601 | $0 | $0 |
Source: Public Records
Map
Nearby Homes
- 143 E 100 N
- 321 E 100 S
- 327 E 300 South St
- 89 W Veterans Way
- 455 Rock Creek Dr
- 0 Utah 28
- 564 S Main St
- 460 W 100 North St
- 431 W Center St
- 432 W Center St
- 415 W 100 St S
- 622 S Main
- 692 S Main St
- 115 E 470 N
- 130 E 470 N
- 130 E 300 St N
- 275 N Main St Unit 31
- 350 E 200 North St
- 90 N 100 East St
- 10 N Main