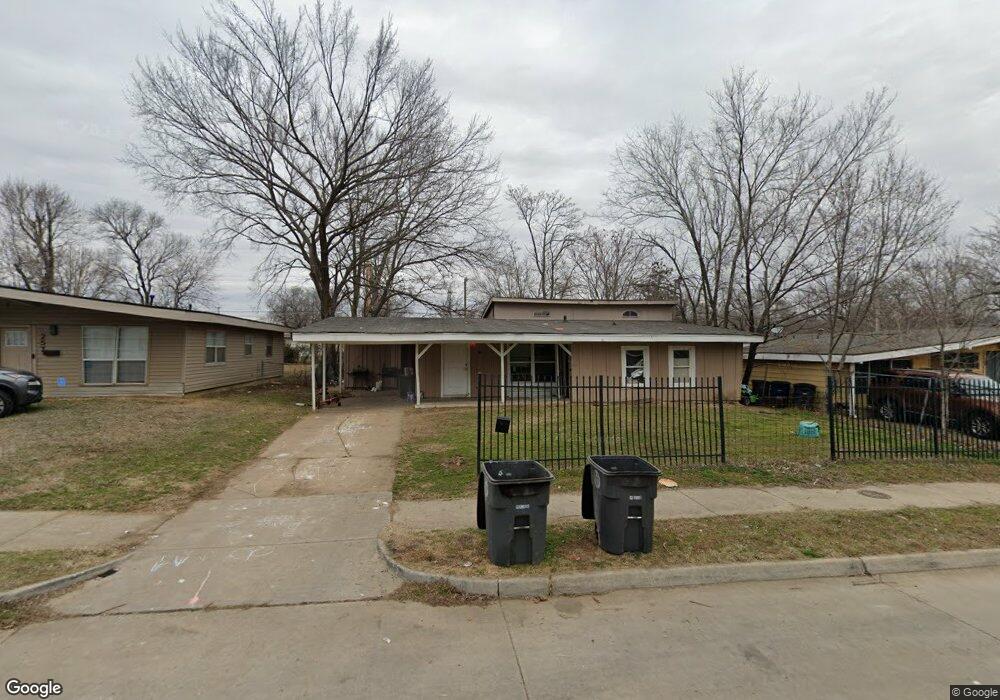
261 E 54th St N Tulsa, OK 74126
Chamberlain NeighborhoodEstimated Value: $97,574 - $124,000
3
Beds
2
Baths
1,392
Sq Ft
$78/Sq Ft
Est. Value
About This Home
This home is located at 261 E 54th St N, Tulsa, OK 74126 and is currently estimated at $107,894, approximately $77 per square foot. 261 E 54th St N is a home located in Tulsa County with nearby schools including Monroe Demonstration Academy, McLain High School of Science and Technology, and Tulsa Legacy Charter School.
Ownership History
Date
Name
Owned For
Owner Type
Purchase Details
Closed on
Jun 10, 2014
Sold by
County Of Tulsa
Bought by
Jbjd Real Estate Llc
Current Estimated Value
Purchase Details
Closed on
Dec 15, 2005
Sold by
Precision Equity Llc
Bought by
Mak Kent and Xu Tianye
Home Financials for this Owner
Home Financials are based on the most recent Mortgage that was taken out on this home.
Original Mortgage
$54,000
Interest Rate
10.5%
Mortgage Type
Fannie Mae Freddie Mac
Purchase Details
Closed on
Jun 3, 2005
Sold by
Jp Morgan Chase Bank
Bought by
Precision Equity Llc
Purchase Details
Closed on
Nov 17, 2004
Sold by
Littlejohn David and Littlejohn Diana Lynn
Bought by
Jp Morgan Chase Bank
Purchase Details
Closed on
Jul 27, 2001
Sold by
Dobbins Queen Esther
Bought by
Littlejohn David
Home Financials for this Owner
Home Financials are based on the most recent Mortgage that was taken out on this home.
Original Mortgage
$12,000
Interest Rate
7.07%
Mortgage Type
Seller Take Back
Create a Home Valuation Report for This Property
The Home Valuation Report is an in-depth analysis detailing your home's value as well as a comparison with similar homes in the area
Home Values in the Area
Average Home Value in this Area
Purchase History
| Date | Buyer | Sale Price | Title Company |
|---|---|---|---|
| Jbjd Real Estate Llc | $4,619 | None Available | |
| Mak Kent | $63,000 | True Title | |
| Precision Equity Llc | $15,500 | First American Title & Abstr | |
| Jp Morgan Chase Bank | -- | -- | |
| Littlejohn David | $17,000 | -- |
Source: Public Records
Mortgage History
| Date | Status | Borrower | Loan Amount |
|---|---|---|---|
| Previous Owner | Mak Kent | $54,000 | |
| Previous Owner | Littlejohn David | $12,000 |
Source: Public Records
Tax History
| Year | Tax Paid | Tax Assessment Tax Assessment Total Assessment is a certain percentage of the fair market value that is determined by local assessors to be the total taxable value of land and additions on the property. | Land | Improvement |
|---|---|---|---|---|
| 2025 | $427 | $3,184 | $643 | $2,541 |
| 2024 | $367 | $3,032 | $734 | $2,298 |
| 2023 | $367 | $2,888 | $874 | $2,014 |
| 2022 | $367 | $2,750 | $957 | $1,793 |
| 2021 | $363 | $2,750 | $957 | $1,793 |
| 2020 | $358 | $2,750 | $957 | $1,793 |
| 2019 | $377 | $2,750 | $957 | $1,793 |
| 2018 | $378 | $2,750 | $957 | $1,793 |
| 2017 | $603 | $4,400 | $957 | $3,443 |
| 2016 | $591 | $4,400 | $957 | $3,443 |
| 2015 | $592 | $4,400 | $957 | $3,443 |
| 2014 | $923 | $6,930 | $957 | $5,973 |
Source: Public Records
Map
Nearby Homes
- 241 E 53rd St N
- 414 E 54th St N
- 274 E 53rd St N
- 5439 N Frankfort Ave
- 223 E 52nd St N
- 552 E 55th Place N
- 5462 N Hartford Ave
- 658 E 53rd St N
- 0 N Cincinnati Place
- 5512 N Hartford Place
- 10 E 50th Place N
- 5462 N Johnstown Ave
- 5234 N Kenosha Ave
- 4697 N Boston Place
- 557 E 59th St N
- 554 E 48th Place N
- 4680 N Boston Ave
- 4842 N Johnstown Ave
- 5806 N Madison Ave
- 4604 N Boston Place
- 257 E 54th St N
- 267 E 54th St N
- 262 E 54th Place N
- 253 E 54th St N
- 258 E 54th Place N
- 5418 N Elgin Ave
- 252 E 54th Place N
- 262 E 54th St N
- 247 E 54th St N
- 268 E 54th St N
- 258 E 54th St N
- 272 E 54th St N
- 5403 N Elgin Ave
- 254 E 54th St N
- 5409 N Elgin Ave
- 248 E 54th Place N
- 248 E 54th Place N
- 5415 N Elgin Ave
- 243 E 54th St N
- 404 E 54th St N
Your Personal Tour Guide
Ask me questions while you tour the home.