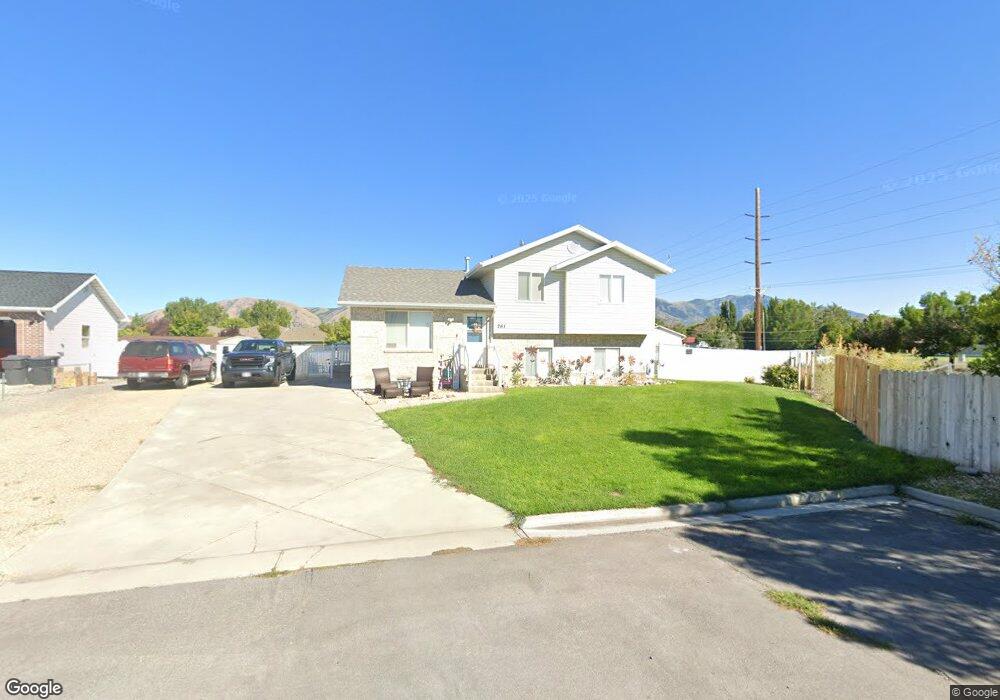
261 E Poplar Ct Garland, UT 84312
Estimated Value: $369,000 - $450,000
4
Beds
3
Baths
2,344
Sq Ft
$173/Sq Ft
Est. Value
About This Home
This home is located at 261 E Poplar Ct, Garland, UT 84312 and is currently estimated at $405,049, approximately $172 per square foot. 261 E Poplar Ct is a home located in Box Elder County with nearby schools including Garland School, Bear River Middle School, and Alice C. Harris Intermediate School.
Ownership History
Date
Name
Owned For
Owner Type
Purchase Details
Closed on
Dec 1, 2015
Sold by
Esquivel Jose Gabriel
Bought by
Esquivel Suzanna L
Current Estimated Value
Purchase Details
Closed on
May 19, 2005
Sold by
Wardle Sherry Lynn
Bought by
Esquivel Suzanna L and Esquivel Jose Gabriel
Home Financials for this Owner
Home Financials are based on the most recent Mortgage that was taken out on this home.
Original Mortgage
$134,640
Outstanding Balance
$70,337
Interest Rate
5.87%
Mortgage Type
New Conventional
Estimated Equity
$334,712
Create a Home Valuation Report for This Property
The Home Valuation Report is an in-depth analysis detailing your home's value as well as a comparison with similar homes in the area
Home Values in the Area
Average Home Value in this Area
Purchase History
We collect this data history from publicly available records. To have your information removed, we recommend requesting removal directly through your county’s website.
| Date | Buyer | Sale Price | Title Company |
|---|---|---|---|
| Esquivel Suzanna L | -- | American Secure Title Tremon | |
| Esquivel Suzanna L | -- | None Available |
Source: Public Records
Mortgage History
We collect this data history from publicly available records. To have your information removed, we recommend requesting removal directly through your county’s website.
| Date | Status | Borrower | Loan Amount |
|---|---|---|---|
| Open | Esquivel Suzanna L | $134,640 |
Source: Public Records
Tax History
| Year | Tax Paid | Tax Assessment Tax Assessment Total Assessment is a certain percentage of the fair market value that is determined by local assessors to be the total taxable value of land and additions on the property. | Land | Improvement |
|---|---|---|---|---|
| 2025 | $2,449 | $380,508 | $105,000 | $275,508 |
| 2024 | $2,160 | $378,742 | $100,000 | $278,742 |
| 2023 | $2,025 | $350,096 | $90,000 | $260,096 |
| 2022 | $2,073 | $184,603 | $16,500 | $168,103 |
| 2021 | $1,600 | $218,708 | $30,000 | $188,708 |
| 2020 | $1,547 | $218,708 | $30,000 | $188,708 |
| 2019 | $1,446 | $108,349 | $16,500 | $91,849 |
| 2018 | $1,159 | $79,848 | $13,750 | $66,098 |
| 2017 | $1,186 | $145,179 | $13,750 | $120,179 |
| 2016 | $1,120 | $76,701 | $13,750 | $62,951 |
| 2015 | $1,043 | $70,978 | $13,750 | $57,228 |
| 2014 | $1,043 | $68,253 | $13,750 | $54,503 |
| 2013 | -- | $68,253 | $13,338 | $54,915 |
Source: Public Records
Map
Nearby Homes
- 267 E Poplar Ct
- 267 E Poplar Ct Unit 33A
- 262 E Poplar Ct
- 262 E Poplar Ct Unit 114
- 260 E Poplar Ct
- 260 E Poplar Ct Unit 35 A
- 260 E Poplar Ct Unit 115
- 255 Willow Ln
- 220 E Poplar Ct Unit 116
- 220 E Poplar Ct
- 210 E Poplar Ct
- 210 E Poplar Ct Unit 118
- 212 E Poplar Ct
- 212 E Poplar Ct Unit 117
- 295 Willow Ln
- 275 E 1400 S
- 235 Willow Ln
- 1332 S 350 E
- 247 E 1400 S
- 247 E 1400 S
Your Personal Tour Guide
Ask me questions while you tour the home.