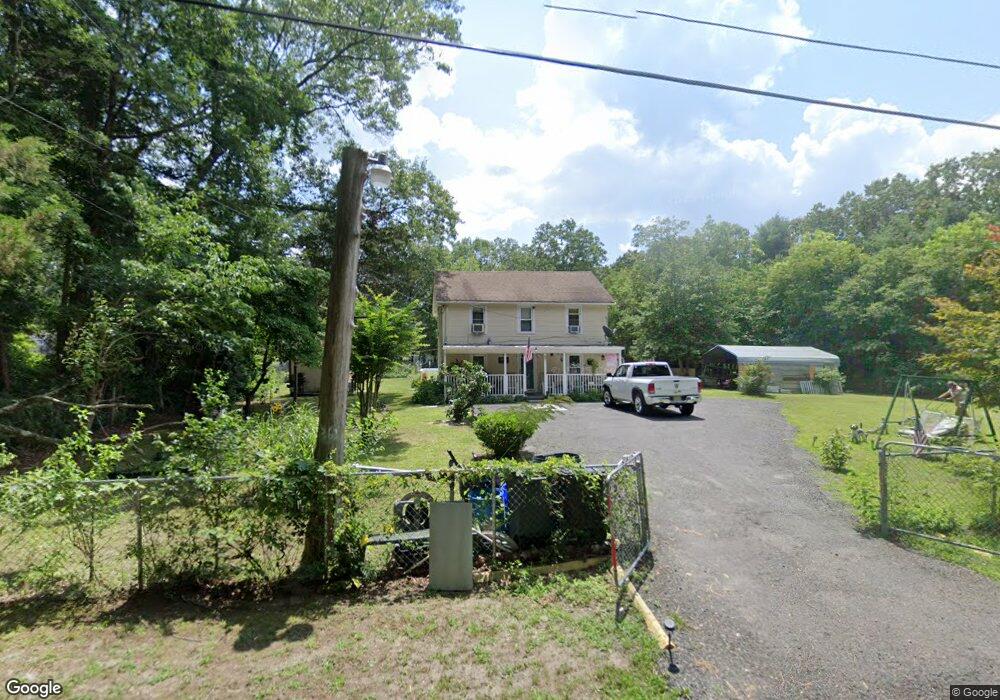
261 Elm St Hammonton, NJ 08037
Estimated Value: $223,000 - $310,000
--
Bed
--
Bath
1,408
Sq Ft
$184/Sq Ft
Est. Value
About This Home
This home is located at 261 Elm St, Hammonton, NJ 08037 and is currently estimated at $258,812, approximately $183 per square foot. 261 Elm St is a home located in Atlantic County with nearby schools including Mullica Township Primary School, Mullica Township Elementary & Middle School, and Cedar Creek High School.
Ownership History
Date
Name
Owned For
Owner Type
Purchase Details
Closed on
Mar 22, 2012
Sold by
Barreto Daniel
Bought by
Barretto Carmen L
Current Estimated Value
Purchase Details
Closed on
Dec 13, 2006
Sold by
Barreto Carmen
Bought by
Barreto Daniel and Barreto Carmen
Home Financials for this Owner
Home Financials are based on the most recent Mortgage that was taken out on this home.
Original Mortgage
$215,000
Outstanding Balance
$128,401
Interest Rate
6.29%
Mortgage Type
Purchase Money Mortgage
Estimated Equity
$130,411
Purchase Details
Closed on
May 17, 1991
Sold by
Patram Hemwattee
Bought by
Perez Carmen
Purchase Details
Closed on
Apr 18, 1991
Sold by
Sheivdayal Dynalall
Bought by
Perez Carmen
Purchase Details
Closed on
Oct 7, 1988
Sold by
Nieves Monserrate and Nieves Eulalia
Bought by
Shievdayal Dynalall
Create a Home Valuation Report for This Property
The Home Valuation Report is an in-depth analysis detailing your home's value as well as a comparison with similar homes in the area
Home Values in the Area
Average Home Value in this Area
Purchase History
| Date | Buyer | Sale Price | Title Company |
|---|---|---|---|
| Barretto Carmen L | -- | None Available | |
| Barreto Daniel | -- | -- | |
| Perez Carmen | $57,900 | -- | |
| Patram Hemwatee | $57,900 | -- | |
| Perez Carmen | $57,900 | -- | |
| Shievdayal Dynalall | $36,500 | -- |
Source: Public Records
Mortgage History
| Date | Status | Borrower | Loan Amount |
|---|---|---|---|
| Open | Barreto Daniel | $215,000 |
Source: Public Records
Tax History Compared to Growth
Tax History
| Year | Tax Paid | Tax Assessment Tax Assessment Total Assessment is a certain percentage of the fair market value that is determined by local assessors to be the total taxable value of land and additions on the property. | Land | Improvement |
|---|---|---|---|---|
| 2025 | $4,364 | $121,300 | $48,100 | $73,200 |
| 2024 | $4,364 | $121,300 | $48,100 | $73,200 |
| 2023 | $4,138 | $121,300 | $48,100 | $73,200 |
| 2022 | $4,138 | $121,300 | $48,100 | $73,200 |
| 2021 | $3,974 | $121,300 | $48,100 | $73,200 |
| 2020 | $3,871 | $121,300 | $48,100 | $73,200 |
| 2019 | $3,793 | $121,300 | $48,100 | $73,200 |
| 2018 | $3,016 | $64,200 | $14,200 | $50,000 |
| 2017 | $3,014 | $64,200 | $14,200 | $50,000 |
| 2016 | $2,836 | $64,200 | $14,200 | $50,000 |
| 2015 | $2,694 | $64,200 | $14,200 | $50,000 |
| 2014 | $2,664 | $64,200 | $14,200 | $50,000 |
Source: Public Records
Map
Nearby Homes
- 1021 Reading Ave
- 4501 S White Horse Pike
- 4640 Frazier Ave
- 154 24th Ave
- 4166 Anna Dr
- 4179 E Adams Cir
- 551 Wharton Park Blvd
- 547 Wharton Park Blvd
- 4160 Anna Dr
- 541 Wharton Park Blvd
- 4834 White Horse Pike
- 700 Columbia Rd
- 900 Elwood Rd
- 900 Elwood Rd Unit MULLICA TWP
- 4075 W Adams Cir
- 0 Columbia Rd Unit NJAC2012962
- 0 Columbia Rd Unit 586593
- 4821 Moss Mill Rd
- 4930 Moss Mill Rd
- 4649 N Black Oak Cir