Estimated Value: $249,000 - $275,000
3
Beds
3
Baths
1,596
Sq Ft
$165/Sq Ft
Est. Value
About This Home
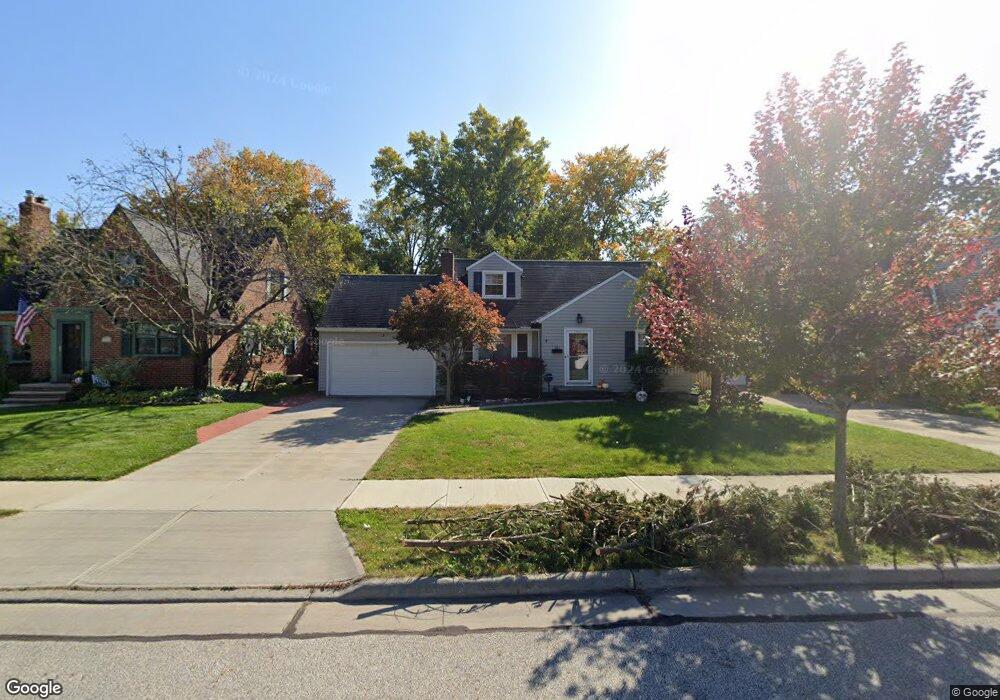
This home is located at 261 Elmwood Dr, Berea, OH 44017 and is currently estimated at $264,087, approximately $165 per square foot. 261 Elmwood Dr is a home located in Cuyahoga County with nearby schools including Grindstone Elementary School, Berea-Midpark Middle School, and Berea-Midpark High School.
Ownership History
Date
Name
Owned For
Owner Type
Purchase Details
Closed on
Jul 24, 2007
Sold by
Nalazek Donna Sue
Bought by
Mouat Douglas J and Mouat Susan M
Current Estimated Value
Home Financials for this Owner
Home Financials are based on the most recent Mortgage that was taken out on this home.
Original Mortgage
$141,550
Outstanding Balance
$89,668
Interest Rate
6.76%
Mortgage Type
Purchase Money Mortgage
Estimated Equity
$174,419
Purchase Details
Closed on
Mar 7, 1997
Sold by
Est Margaret W Griffin
Bought by
Stone Kent N
Home Financials for this Owner
Home Financials are based on the most recent Mortgage that was taken out on this home.
Original Mortgage
$108,800
Interest Rate
7.43%
Mortgage Type
New Conventional
Purchase Details
Closed on
Nov 1, 1983
Sold by
Griffin Thomas V and Griffin Margaret
Bought by
Griffin Margaret Wilson
Purchase Details
Closed on
Jan 1, 1975
Bought by
Griffin Thomas and Griffin Margaret
Create a Home Valuation Report for This Property
The Home Valuation Report is an in-depth analysis detailing your home's value as well as a comparison with similar homes in the area
Home Values in the Area
Average Home Value in this Area
Purchase History
| Date | Buyer | Sale Price | Title Company |
|---|---|---|---|
| Mouat Douglas J | $149,000 | First American Title Ins C | |
| Stone Kent N | $136,000 | -- | |
| Griffin Margaret Wilson | -- | -- | |
| Griffin Thomas | -- | -- |
Source: Public Records
Mortgage History
| Date | Status | Borrower | Loan Amount |
|---|---|---|---|
| Open | Mouat Douglas J | $141,550 | |
| Previous Owner | Stone Kent N | $108,800 |
Source: Public Records
Tax History Compared to Growth
Tax History
| Year | Tax Paid | Tax Assessment Tax Assessment Total Assessment is a certain percentage of the fair market value that is determined by local assessors to be the total taxable value of land and additions on the property. | Land | Improvement |
|---|---|---|---|---|
| 2024 | $4,269 | $73,745 | $11,830 | $61,915 |
| 2023 | $3,940 | $57,050 | $10,640 | $46,410 |
| 2022 | $3,915 | $57,050 | $10,640 | $46,410 |
| 2021 | $3,882 | $57,050 | $10,640 | $46,410 |
| 2020 | $3,710 | $48,370 | $9,030 | $39,340 |
| 2019 | $3,611 | $138,200 | $25,800 | $112,400 |
| 2018 | $3,596 | $48,370 | $9,030 | $39,340 |
| 2017 | $3,756 | $46,940 | $9,660 | $37,280 |
| 2016 | $3,727 | $46,450 | $9,660 | $36,790 |
| 2015 | $3,486 | $46,450 | $9,660 | $36,790 |
| 2014 | $3,486 | $46,450 | $9,660 | $36,790 |
Source: Public Records
Map
Nearby Homes