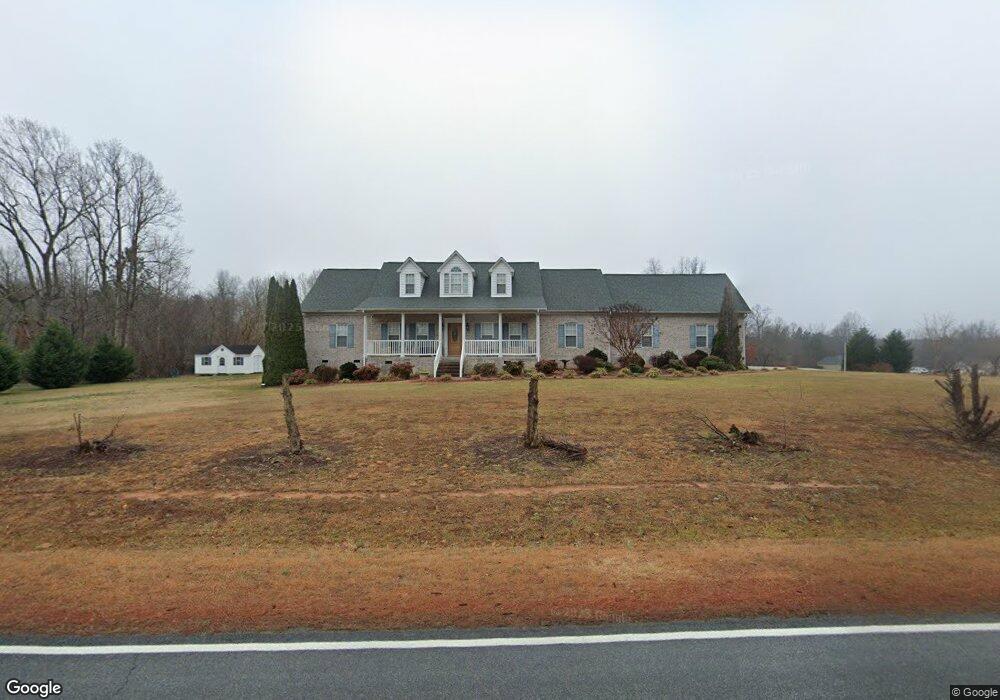
261 Hedrick Dr Henderson, NC 27537
Estimated Value: $498,932 - $604,000
3
Beds
4
Baths
3,256
Sq Ft
$175/Sq Ft
Est. Value
About This Home
This home is located at 261 Hedrick Dr, Henderson, NC 27537 and is currently estimated at $569,483, approximately $174 per square foot. 261 Hedrick Dr is a home located in Vance County with nearby schools including E.O. Young Jr. Elementary School and Vance County High School.
Ownership History
Date
Name
Owned For
Owner Type
Purchase Details
Closed on
Nov 20, 2014
Sold by
Rodriguez Jose Antonio and Rodriguez Juana
Bought by
Hauter Ahmed and Hauter Hadiyah
Current Estimated Value
Home Financials for this Owner
Home Financials are based on the most recent Mortgage that was taken out on this home.
Original Mortgage
$216,000
Interest Rate
3.25%
Mortgage Type
Adjustable Rate Mortgage/ARM
Purchase Details
Closed on
Jun 21, 2012
Sold by
Lee Walter G and Lee Jacqueline H
Bought by
Rodriguez Jose Antonio
Home Financials for this Owner
Home Financials are based on the most recent Mortgage that was taken out on this home.
Original Mortgage
$200,000
Interest Rate
3.79%
Create a Home Valuation Report for This Property
The Home Valuation Report is an in-depth analysis detailing your home's value as well as a comparison with similar homes in the area
Purchase History
We collect this data history from publicly available records. To have your information removed, we recommend requesting removal directly through your county’s website.
| Date | Buyer | Sale Price | Title Company |
|---|---|---|---|
| Hauter Ahmed | $270,000 | None Available | |
| Rodriguez Jose Antonio | -- | None Available | |
| Rodriguez Jose Antonio | $280,000 | None Available |
Source: Public Records
Mortgage History
We collect this data history from publicly available records. To have your information removed, we recommend requesting removal directly through your county’s website.
| Date | Status | Borrower | Loan Amount |
|---|---|---|---|
| Previous Owner | Hauter Ahmed | $216,000 | |
| Previous Owner | Rodriguez Jose Antonio | $200,000 | |
| Previous Owner | Rodriguez Jose Antonio | $200,000 |
Source: Public Records
Tax History
| Year | Tax Paid | Tax Assessment Tax Assessment Total Assessment is a certain percentage of the fair market value that is determined by local assessors to be the total taxable value of land and additions on the property. | Land | Improvement |
|---|---|---|---|---|
| 2025 | $3,727 | $445,984 | $30,000 | $415,984 |
| 2024 | $3,617 | $445,984 | $30,000 | $415,984 |
| 2023 | $2,928 | $286,814 | $20,000 | $266,814 |
| 2022 | $2,928 | $286,814 | $20,000 | $266,814 |
| 2021 | $2,808 | $286,814 | $20,000 | $266,814 |
| 2020 | $2,925 | $286,814 | $20,000 | $266,814 |
| 2019 | $2,920 | $286,814 | $20,000 | $266,814 |
| 2018 | $2,679 | $286,814 | $20,000 | $266,814 |
| 2017 | $2,784 | $286,814 | $20,000 | $266,814 |
| 2016 | $2,784 | $286,814 | $20,000 | $266,814 |
| 2015 | $2,386 | $385,000 | $45,000 | $340,000 |
| 2014 | $3,308 | $385,000 | $45,000 | $340,000 |
Source: Public Records
Map
Nearby Homes
- 2732 Nutbush Rd
- 1157 Franklin Ln
- 2118 Nutbush Rd
- 892 Franklin Ln
- 0 Mabry Mill Rd
- 675 Anderson Creek Rd
- 1159 Flemingtown Rd
- 1595 Spring Valley Lake Rd
- 1135 Peninsula Ln
- 52 Buoy Dr
- 1020 Jackson Royster Rd
- 5141 N Carolina 39
- 540 Flanagan Rd
- 96 Holly Cir
- 148 Baptist Church Rd
- 1176 Cedar Cove Rd
- 55 Spring Ln
- 1070 Cedar Cove Rd
- 0 Cedar Cove Rd
- 0 N Nc 39 Hwy Unit 10147453
- 59 Strawberry Ln
- 281 Hedrick Dr
- 268 Hedrick Dr
- 189 Hedrick Dr
- 79 Strawberry Ln
- 100 Strawberry Ln
- 321 Hedrick Dr
- 78 Kerr Cir
- 331 Hedrick Dr
- Lot 112 Kerr Cir
- 384 Hedrick Dr
- 105 Strawberry Ln
- 127 Hedrick Dr
- 110 Strawberry Ln
- 81 Kerr Cir
- 341 Hedrick Dr
- 25 Kerr Cir
- 111 Strawberry Ln
- 0 Strawberry Ln Unit 1656812
- Lot 6 Strawberry Ln
Your Personal Tour Guide
Ask me questions while you tour the home.