Estimated Value: $609,000 - $844,308
8
Beds
2
Baths
1,480
Sq Ft
$492/Sq Ft
Est. Value
About This Home
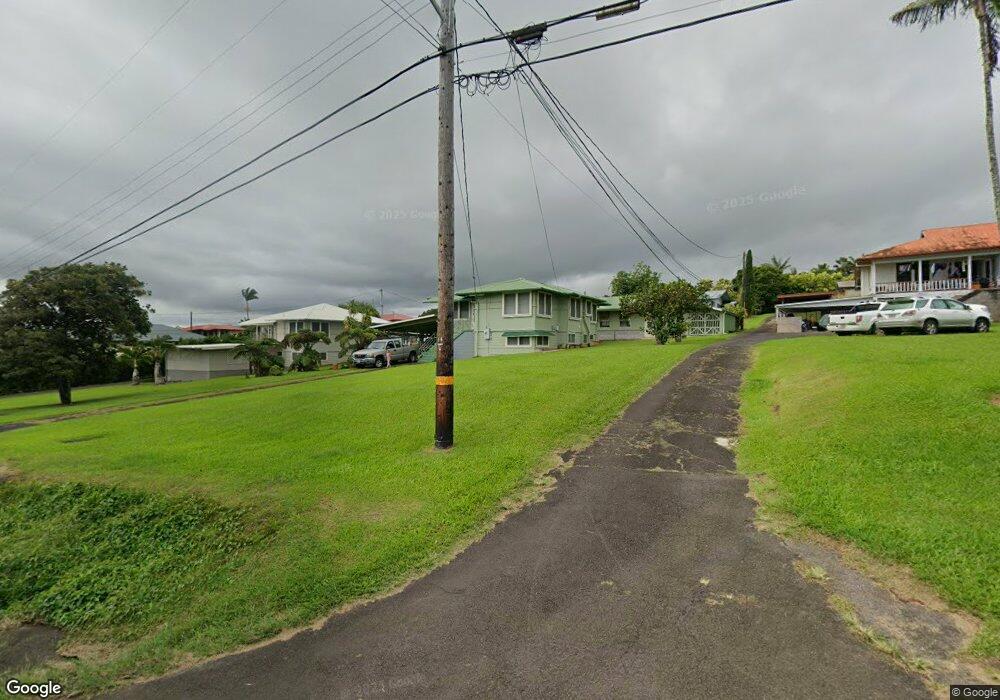
This home is located at 261 Kulana St, Hilo, HI 96720 and is currently estimated at $728,327, approximately $492 per square foot. 261 Kulana St is a home located in Hawaii County with nearby schools including Prince Jonah Kuhio Kalanianaole Elementary, Hilo High School, and Connections Public Charter School.
Ownership History
Date
Name
Owned For
Owner Type
Purchase Details
Closed on
Apr 13, 2022
Sold by
Mark W Crivello Gst Exempt Trust
Bought by
Crivello Royden J and Crivello Jessica Gisela
Current Estimated Value
Home Financials for this Owner
Home Financials are based on the most recent Mortgage that was taken out on this home.
Original Mortgage
$249,900
Outstanding Balance
$233,724
Interest Rate
3.85%
Mortgage Type
New Conventional
Estimated Equity
$494,603
Purchase Details
Closed on
Feb 16, 2018
Sold by
Ex Crivello Paul J
Bought by
Crivello Mark W and Crivello Royden J
Purchase Details
Closed on
Dec 16, 2003
Sold by
Crivello Reynold Manuel
Bought by
Crivello Reynold Manuel
Purchase Details
Closed on
Sep 27, 2001
Sold by
Crivello Katherine
Bought by
Crivello Reynold Manuel and The Reynold Manuel Crivello Gst Exempt T
Create a Home Valuation Report for This Property
The Home Valuation Report is an in-depth analysis detailing your home's value as well as a comparison with similar homes in the area
Home Values in the Area
Average Home Value in this Area
Purchase History
| Date | Buyer | Sale Price | Title Company |
|---|---|---|---|
| Crivello Royden J | $200,000 | Old Republic Title | |
| Crivello Royden J | $200,000 | Old Republic Title | |
| Crivello Mark W | -- | None Available | |
| Crivello Reynold Manuel | -- | -- | |
| Crivello Reynold Manuel | -- | -- |
Source: Public Records
Mortgage History
| Date | Status | Borrower | Loan Amount |
|---|---|---|---|
| Open | Crivello Royden J | $249,900 | |
| Closed | Crivello Royden J | $249,900 |
Source: Public Records
Tax History Compared to Growth
Tax History
| Year | Tax Paid | Tax Assessment Tax Assessment Total Assessment is a certain percentage of the fair market value that is determined by local assessors to be the total taxable value of land and additions on the property. | Land | Improvement |
|---|---|---|---|---|
| 2025 | $1,525 | $394,400 | $179,700 | $214,700 |
| 2024 | $1,525 | $382,900 | $179,700 | $203,200 |
| 2023 | $1,522 | $371,700 | $179,700 | $192,000 |
| 2022 | $1,530 | $360,900 | $179,700 | $181,200 |
| 2021 | $1,478 | $350,400 | $179,700 | $170,700 |
| 2020 | $1,428 | $340,200 | $179,500 | $160,700 |
| 2019 | $1,415 | $675,000 | $359,000 | $316,000 |
| 2018 | $3,548 | $319,600 | $168,200 | $151,400 |
| 2017 | $200 | $149,400 | $58,500 | $90,900 |
| 2016 | $221 | $145,000 | $58,500 | $86,500 |
| 2015 | $111 | $140,800 | $58,500 | $82,300 |
| 2014 | $111 | $136,700 | $58,500 | $78,200 |
Source: Public Records
Map
Nearby Homes
- 0 Kahoa Place
- 56 Nanea St
- 120 Woa Rd
- 27-2466 Kahala Place
- 27-1958 Kaaukai Place
- 16 Haaheo Rd
- 647 Kauhiula Rd
- 430 Kaiwiki Rd
- 529 Wainaku St
- 27-223 D Rd
- 291 Wainaku St
- 27-239 Kaapoko Homestead Rd
- 27-319 Kaieie Rd
- 287 Wainaku St
- 289 Wainaku St
- 360 Kauila St Unit 101
- 360 Kauila St Unit 112
- 84 Pukihae St Unit PH6
- 84 Pukihae St Unit 406
- 84 Pukihae St Unit 802