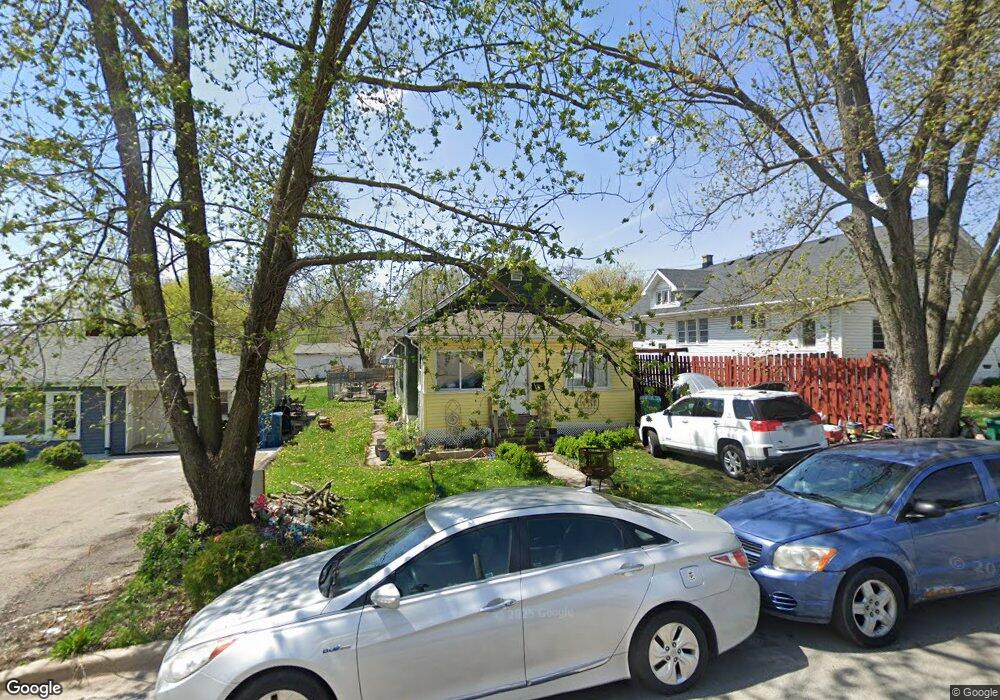
261 Leach Ave Joliet, IL 60432
Belmont NeighborhoodEstimated Value: $138,000 - $187,000
3
Beds
1
Bath
1,008
Sq Ft
$159/Sq Ft
Est. Value
About This Home
This home is located at 261 Leach Ave, Joliet, IL 60432 and is currently estimated at $160,513, approximately $159 per square foot. 261 Leach Ave is a home located in Will County with nearby schools including A.O. Marshall Elementary School, Gompers Junior High School, and Joliet Central High School.
Ownership History
Date
Name
Owned For
Owner Type
Purchase Details
Closed on
Mar 2, 2021
Sold by
Wallace Patricia and Wallace Frank J
Bought by
Salez Yurirula
Current Estimated Value
Purchase Details
Closed on
Oct 31, 2011
Sold by
Allen Otha R
Bought by
Wallace Patricia
Purchase Details
Closed on
Dec 16, 2005
Sold by
Allen Otha R and Otha Allen Trust
Bought by
Allen Otha and Otha R Allen Trust
Purchase Details
Closed on
Jun 10, 2005
Sold by
Allen Bryan Steven
Bought by
Otha Allen Trust
Purchase Details
Closed on
Mar 15, 2005
Sold by
Allen Otha
Bought by
Otha Allen Trust
Purchase Details
Closed on
Aug 5, 2003
Sold by
Ronald J Orloff Llc
Bought by
Allen Samuel and Allen Otha R
Purchase Details
Closed on
Nov 3, 2000
Sold by
Hester Josephine M
Bought by
Ronald J Orloff Llc
Create a Home Valuation Report for This Property
The Home Valuation Report is an in-depth analysis detailing your home's value as well as a comparison with similar homes in the area
Home Values in the Area
Average Home Value in this Area
Purchase History
| Date | Buyer | Sale Price | Title Company |
|---|---|---|---|
| Salez Yurirula | -- | None Available | |
| Wallace Patricia | -- | None Available | |
| Allen Otha | -- | None Available | |
| Otha Allen Trust | -- | -- | |
| Otha Allen Trust | -- | -- | |
| Allen Samuel | $68,000 | -- | |
| Ronald J Orloff Llc | $63,000 | -- |
Source: Public Records
Tax History Compared to Growth
Tax History
| Year | Tax Paid | Tax Assessment Tax Assessment Total Assessment is a certain percentage of the fair market value that is determined by local assessors to be the total taxable value of land and additions on the property. | Land | Improvement |
|---|---|---|---|---|
| 2024 | $2,895 | $43,044 | $7,677 | $35,367 |
| 2023 | $2,895 | $38,244 | $6,821 | $31,423 |
| 2022 | $2,634 | $34,594 | $6,170 | $28,424 |
| 2021 | $3,032 | $32,310 | $5,763 | $26,547 |
| 2020 | $2,896 | $30,684 | $5,473 | $25,211 |
| 2019 | $2,721 | $28,516 | $5,086 | $23,430 |
| 2018 | $2,535 | $25,551 | $4,555 | $20,996 |
| 2017 | $2,430 | $23,230 | $4,141 | $19,089 |
| 2016 | $2,285 | $20,957 | $3,786 | $17,171 |
| 2015 | $2,173 | $19,650 | $3,550 | $16,100 |
| 2014 | $2,173 | $19,550 | $3,550 | $16,000 |
| 2013 | $2,173 | $20,731 | $3,930 | $16,801 |
Source: Public Records
Map
Nearby Homes
- 1106 Sterling Ave
- 330 Harwood St
- 1602 E Cass St
- 1100 E Washington St
- 302 Henderson Ave
- 111 Court St
- 409 Cayuga St
- 830 Porter St
- 106 Hillsdale Rd
- 251 E Jackson St
- 402 Miami St
- 601 Cayuga St
- 532 Cayuga St
- 110 Arizona Ave
- 1516 E Washington St
- 616 Norton Ave
- 569 E Cass St
- 570 E Dover St
- 2 Peale St
- 4 Peale St