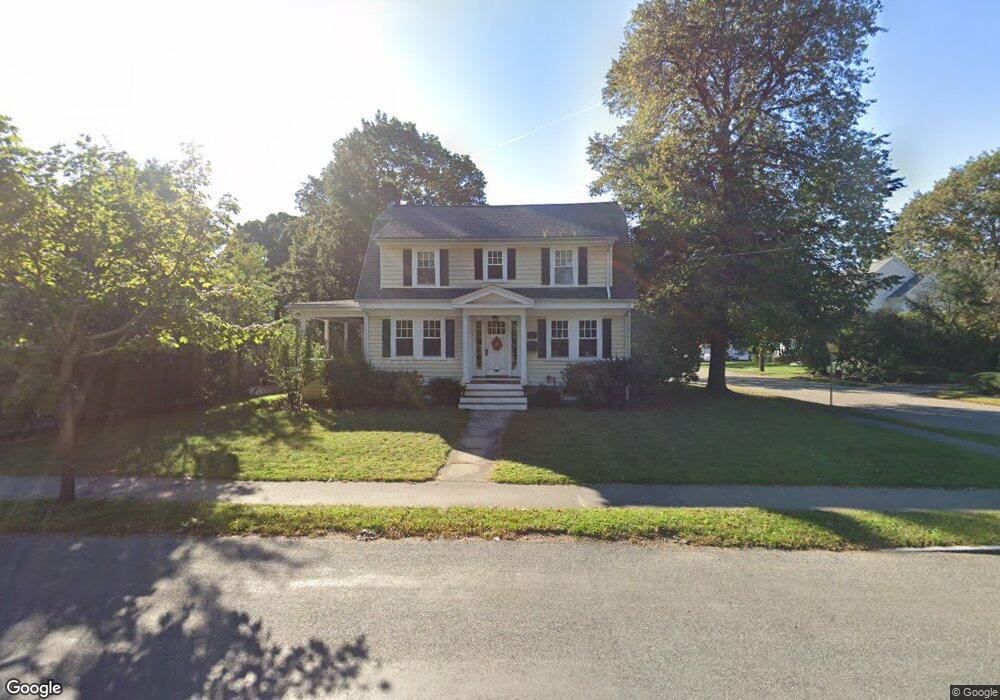
261 Manning St Needham, MA 02492
Estimated Value: $1,600,222 - $2,039,000
5
Beds
3
Baths
3,023
Sq Ft
$608/Sq Ft
Est. Value
About This Home
This home is located at 261 Manning St, Needham, MA 02492 and is currently estimated at $1,836,556, approximately $607 per square foot. 261 Manning St is a home located in Norfolk County with nearby schools including Mitchell Elementary School, High Rock Middle School, and Pollard Middle School.
Ownership History
Date
Name
Owned For
Owner Type
Purchase Details
Closed on
Jul 31, 2007
Sold by
Diplacido Daniel and Diplacido Ciarna M
Bought by
Keyes Kenneth J and Keyes Georgina Y
Current Estimated Value
Home Financials for this Owner
Home Financials are based on the most recent Mortgage that was taken out on this home.
Original Mortgage
$940,000
Interest Rate
6.78%
Mortgage Type
Purchase Money Mortgage
Purchase Details
Closed on
Jul 13, 2001
Sold by
Svendsen Alice M
Bought by
Diplacido Daniel and Diplacido Ciarna M
Create a Home Valuation Report for This Property
The Home Valuation Report is an in-depth analysis detailing your home's value as well as a comparison with similar homes in the area
Home Values in the Area
Average Home Value in this Area
Purchase History
| Date | Buyer | Sale Price | Title Company |
|---|---|---|---|
| Keyes Kenneth J | $1,175,000 | -- | |
| Diplacido Daniel | $432,500 | -- |
Source: Public Records
Mortgage History
| Date | Status | Borrower | Loan Amount |
|---|---|---|---|
| Open | Diplacido Daniel | $912,000 | |
| Closed | Keyes Kenneth J | $940,000 | |
| Previous Owner | Diplacido Daniel | $100,000 | |
| Previous Owner | Diplacido Daniel | $67,000 |
Source: Public Records
Tax History
| Year | Tax Paid | Tax Assessment Tax Assessment Total Assessment is a certain percentage of the fair market value that is determined by local assessors to be the total taxable value of land and additions on the property. | Land | Improvement |
|---|---|---|---|---|
| 2025 | $13,354 | $1,259,800 | $793,600 | $466,200 |
| 2024 | $13,989 | $1,117,300 | $576,400 | $540,900 |
| 2023 | $14,051 | $1,077,500 | $576,400 | $501,100 |
| 2022 | $13,569 | $1,014,900 | $533,700 | $481,200 |
| 2021 | $13,224 | $1,014,900 | $533,700 | $481,200 |
| 2020 | $13,212 | $1,057,800 | $533,700 | $524,100 |
| 2019 | $12,358 | $997,400 | $485,200 | $512,200 |
| 2018 | $11,221 | $944,500 | $485,200 | $459,300 |
| 2017 | $10,601 | $891,600 | $485,200 | $406,400 |
| 2016 | $10,289 | $891,600 | $485,200 | $406,400 |
| 2015 | $10,066 | $891,600 | $485,200 | $406,400 |
| 2014 | $9,484 | $814,800 | $421,800 | $393,000 |
Source: Public Records
Map
Nearby Homes
- 638 Webster St
- 638 Webster St Unit 638
- 36 Otis St Unit 36
- 190 Brookline St
- 19 Oakland Ave Unit 19
- 19 Highland Ct Unit 19
- 510 Webster St
- 17 Lindbergh Ave
- 58 Morton St
- 193 Garden St
- 100 Bradford St
- 176 Highgate St
- 7 West St
- 40 High St
- 68 Brookline St
- 447 Hillside Ave
- 100 Rosemary Way Unit 129
- 233 Warren St
- 31 Birds Hill Ave
- 385 Hillside Ave
- 267 Manning St
- 251 Manning St
- 15 Holland St
- 14 Holland St
- 273 Manning St
- 18 Holland St
- 258 Manning St
- 247 Manning St
- 268 Manning St
- 252 Manning St
- 277 Manning St
- 9 Holland Terrace
- 274 Manning St
- 24 Holland St
- 246 Manning St
- 239 Manning St
- 4 Holland Terrace
- 29 Gibson St
- 280 Manning St
- 15 Holland Terrace
Your Personal Tour Guide
Ask me questions while you tour the home.