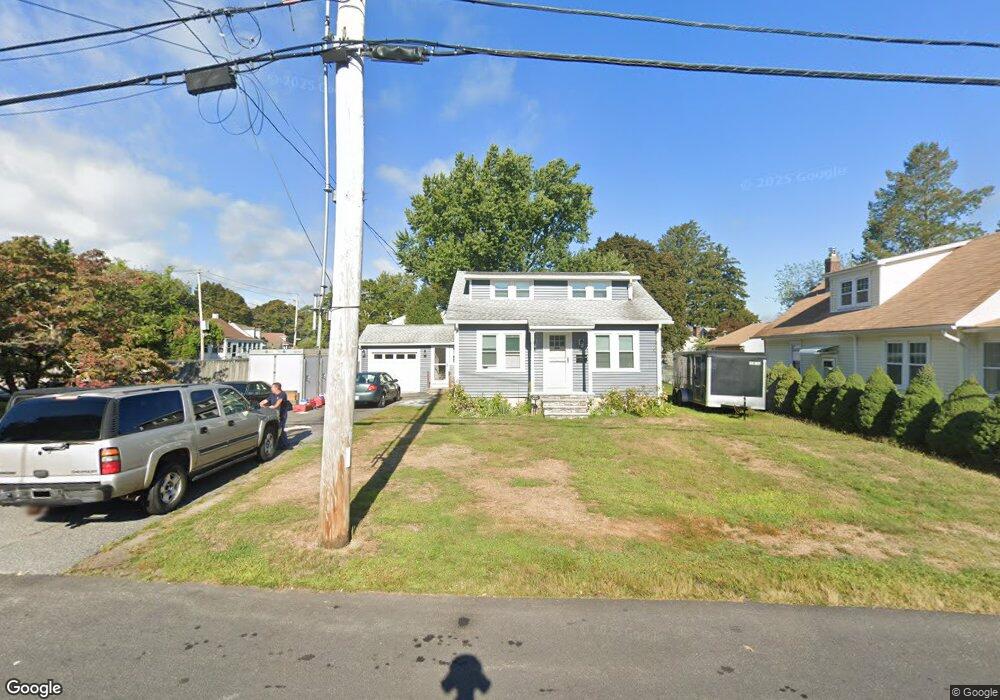
261 Morse Ave Warwick, RI 02886
Greenwood NeighborhoodEstimated Value: $377,000 - $426,000
3
Beds
1
Bath
1,588
Sq Ft
$248/Sq Ft
Est. Value
About This Home
This home is located at 261 Morse Ave, Warwick, RI 02886 and is currently estimated at $394,450, approximately $248 per square foot. 261 Morse Ave is a home located in Kent County with nearby schools including St Rose Of Lima School.
Ownership History
Date
Name
Owned For
Owner Type
Purchase Details
Closed on
Jun 27, 2003
Sold by
Sullivan Thomas K
Bought by
Sullivan Michael K
Current Estimated Value
Home Financials for this Owner
Home Financials are based on the most recent Mortgage that was taken out on this home.
Original Mortgage
$120,000
Outstanding Balance
$51,165
Interest Rate
5.53%
Mortgage Type
Purchase Money Mortgage
Estimated Equity
$343,285
Purchase Details
Closed on
Sep 3, 1997
Sold by
R & M Properties Llc
Bought by
Sullivan Thomas K
Home Financials for this Owner
Home Financials are based on the most recent Mortgage that was taken out on this home.
Original Mortgage
$81,000
Interest Rate
7.36%
Mortgage Type
Purchase Money Mortgage
Create a Home Valuation Report for This Property
The Home Valuation Report is an in-depth analysis detailing your home's value as well as a comparison with similar homes in the area
Home Values in the Area
Average Home Value in this Area
Purchase History
| Date | Buyer | Sale Price | Title Company |
|---|---|---|---|
| Sullivan Michael K | $171,000 | -- | |
| Sullivan Thomas K | $86,000 | -- |
Source: Public Records
Mortgage History
| Date | Status | Borrower | Loan Amount |
|---|---|---|---|
| Open | Sullivan Thomas K | $50,000 | |
| Open | Sullivan Thomas K | $120,000 | |
| Previous Owner | Sullivan Thomas K | $81,000 |
Source: Public Records
Tax History
| Year | Tax Paid | Tax Assessment Tax Assessment Total Assessment is a certain percentage of the fair market value that is determined by local assessors to be the total taxable value of land and additions on the property. | Land | Improvement |
|---|---|---|---|---|
| 2025 | $4,150 | $326,800 | $111,900 | $214,900 |
| 2024 | $3,756 | $259,600 | $92,500 | $167,100 |
| 2023 | $3,684 | $259,600 | $92,500 | $167,100 |
| 2022 | $3,574 | $190,800 | $65,500 | $125,300 |
| 2021 | $3,135 | $167,400 | $65,500 | $101,900 |
| 2020 | $3,135 | $167,400 | $65,500 | $101,900 |
| 2019 | $3,135 | $167,400 | $65,500 | $101,900 |
| 2018 | $2,804 | $134,800 | $64,500 | $70,300 |
| 2017 | $2,728 | $134,800 | $64,500 | $70,300 |
| 2016 | $2,728 | $134,800 | $64,500 | $70,300 |
| 2015 | $2,749 | $132,500 | $66,400 | $66,100 |
| 2014 | $2,658 | $132,500 | $66,400 | $66,100 |
| 2013 | $2,622 | $132,500 | $66,400 | $66,100 |
Source: Public Records
Map
Nearby Homes
- 233 Palace Ave
- 143 Morse Ave
- 157 George Arden Ave
- 74 Stephens Ave
- 5 Barre Ct
- 2907 Post Rd Unit 4
- 2907 Post Rd Unit 2
- 2907 Post Rd Unit 3
- 6 Lillian Ct
- 86 Red Maple Ln
- 62 Red Maple Ln
- 88 Child Ln
- 38 Red Maple Ln
- 28 Burgess Dr
- 45 Tourtelot Ave
- 816 Williamsbug Cir Unit 816
- 833 Halifax Dr
- 44 Westbrook Rd
- 122 Edaville Ct
- 333 Greenwood Ave
Your Personal Tour Guide
Ask me questions while you tour the home.