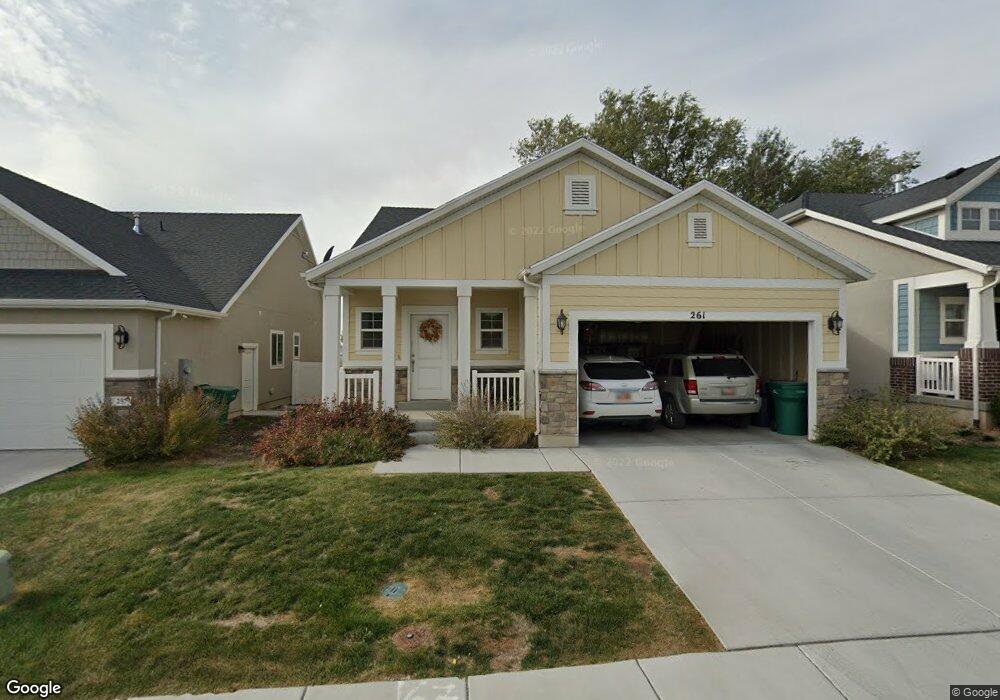
261 N 1125 W Unit 30 Clearfield, UT 84015
Estimated Value: $469,222 - $522,000
3
Beds
2
Baths
1,433
Sq Ft
$342/Sq Ft
Est. Value
About This Home
This home is located at 261 N 1125 W Unit 30, Clearfield, UT 84015 and is currently estimated at $490,306, approximately $342 per square foot. 261 N 1125 W Unit 30 is a home located in Davis County with nearby schools including Holt Elementary School, North Davis Junior High School, and Syracuse High School.
Ownership History
Date
Name
Owned For
Owner Type
Purchase Details
Closed on
Feb 28, 2018
Sold by
Ivory Homes Ltd
Bought by
Muni Beaumont
Current Estimated Value
Home Financials for this Owner
Home Financials are based on the most recent Mortgage that was taken out on this home.
Original Mortgage
$297,511
Outstanding Balance
$261,491
Interest Rate
5.62%
Mortgage Type
FHA
Estimated Equity
$228,815
Purchase Details
Closed on
Oct 1, 2012
Sold by
Clearfield Park Village Llc
Bought by
Ivory Homes Ltd
Purchase Details
Closed on
Nov 15, 2010
Sold by
Ivory Homes Ltd
Bought by
Clearfield Park Village Llc
Purchase Details
Closed on
Sep 30, 2010
Sold by
Federal Deposit Insurance Corporation
Bought by
Ivory Homes Ltd
Purchase Details
Closed on
Nov 9, 2009
Sold by
Gardner Bts Park Village Llc
Bought by
Barnes Banking Company
Create a Home Valuation Report for This Property
The Home Valuation Report is an in-depth analysis detailing your home's value as well as a comparison with similar homes in the area
Home Values in the Area
Average Home Value in this Area
Purchase History
| Date | Buyer | Sale Price | Title Company |
|---|---|---|---|
| Muni Beaumont | -- | Cottonwood Title | |
| Ivory Homes Ltd | -- | Cottonwood Title Ins Agency | |
| Clearfield Park Village Llc | -- | Cottonwood Title Ins Agency | |
| Ivory Homes Ltd | -- | Founders Title Co S | |
| Barnes Banking Company | -- | Founders Title Co Layton |
Source: Public Records
Mortgage History
| Date | Status | Borrower | Loan Amount |
|---|---|---|---|
| Open | Muni Beaumont | $297,511 |
Source: Public Records
Tax History Compared to Growth
Tax History
| Year | Tax Paid | Tax Assessment Tax Assessment Total Assessment is a certain percentage of the fair market value that is determined by local assessors to be the total taxable value of land and additions on the property. | Land | Improvement |
|---|---|---|---|---|
| 2025 | $2,842 | $254,650 | $57,021 | $197,629 |
| 2024 | $2,748 | $248,050 | $54,612 | $193,438 |
| 2023 | $2,517 | $417,000 | $88,760 | $328,240 |
| 2022 | $2,774 | $248,600 | $52,267 | $196,333 |
| 2021 | $2,659 | $360,000 | $48,705 | $311,295 |
| 2020 | $2,328 | $313,000 | $39,802 | $273,198 |
| 2019 | $2,253 | $299,000 | $46,146 | $252,854 |
| 2018 | $2,119 | $274,000 | $38,911 | $235,089 |
| 2016 | $428 | $28,936 | $28,936 | $0 |
| 2015 | $449 | $28,936 | $28,936 | $0 |
| 2014 | $443 | $28,936 | $28,936 | $0 |
| 2013 | -- | $31,443 | $31,443 | $0 |
Source: Public Records
Map
Nearby Homes
- 303 N Canterbury Way
- 417 N 1200 W Unit 84
- 423 N 1250 W Unit 118
- 16 N 1300 W
- 288 N 825 W
- Evergreen Plan at Ivie Meadows
- 274 N 825 W
- 1337 W 550 N Unit 195
- 575 N 1350 W Unit 137
- 620 N 1100 W
- 563 N 1350 W Unit 139
- 777 W 300 N
- 1350 W 300 N Unit 49
- 1350 W 300 N Unit 38
- 1350 W 300 N Unit 29
- 762 W 300 N
- 232 N Rick Way
- 690 Barlow St
- 853 W 700 N
- 135 S 1525 W
- 261 N 1125 W
- 257 N 1125 W Unit 29
- 257 N 1125 W
- 265 N 1125 W Unit 31
- 265 N 1125 W
- 269 N 1125 W Unit 32
- 269 N 1125 W
- 253 N 1125 W Unit 28
- 253 N 1125 W
- 250 N 1200 W
- 1117 W 275 N Unit 41
- 1117 W 275 N
- 1120 W 250 N
- 311 N 1125 W Unit 26
- 262 N 1200 W
- 276 N 1200 W
- 248 N 1200 W
- 1109 W 275 N Unit 42
- 1109 W 275 N
- 273 N 1125 W