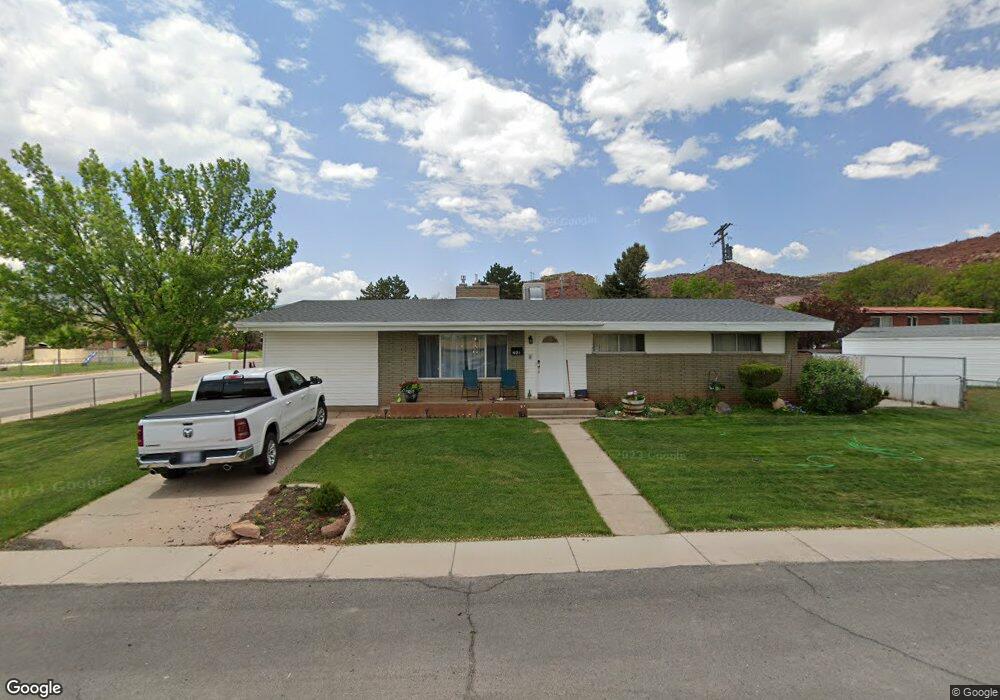
261 N 600 W Richfield, UT 84701
Estimated Value: $307,000 - $373,000
--
Bed
1
Bath
1,791
Sq Ft
$184/Sq Ft
Est. Value
About This Home
This home is located at 261 N 600 W, Richfield, UT 84701 and is currently estimated at $329,855, approximately $184 per square foot. 261 N 600 W is a home located in Sevier County with nearby schools including Pahvant School, Ashman School, and Red Hills Middle School.
Ownership History
Date
Name
Owned For
Owner Type
Purchase Details
Closed on
Feb 17, 2021
Sold by
Langston Patricia
Bought by
Langston Patricia and Langston Joshua Yvon
Current Estimated Value
Purchase Details
Closed on
Feb 17, 2017
Sold by
Langston Michael V and Langston Patricia A
Bought by
Langston Michael and Langston Patricia
Home Financials for this Owner
Home Financials are based on the most recent Mortgage that was taken out on this home.
Original Mortgage
$65,000
Interest Rate
4.12%
Mortgage Type
New Conventional
Create a Home Valuation Report for This Property
The Home Valuation Report is an in-depth analysis detailing your home's value as well as a comparison with similar homes in the area
Home Values in the Area
Average Home Value in this Area
Purchase History
| Date | Buyer | Sale Price | Title Company |
|---|---|---|---|
| Langston Patricia | -- | None Available | |
| Langston Michael | -- | Utah Title |
Source: Public Records
Mortgage History
| Date | Status | Borrower | Loan Amount |
|---|---|---|---|
| Closed | Langston Michael | $65,000 |
Source: Public Records
Tax History Compared to Growth
Tax History
| Year | Tax Paid | Tax Assessment Tax Assessment Total Assessment is a certain percentage of the fair market value that is determined by local assessors to be the total taxable value of land and additions on the property. | Land | Improvement |
|---|---|---|---|---|
| 2024 | $1,408 | $151,958 | $37,763 | $114,195 |
| 2023 | $0 | $157,207 | $33,522 | $123,685 |
| 2022 | $1,371 | $132,005 | $32,313 | $99,692 |
| 2021 | $1,371 | $105,318 | $30,193 | $75,125 |
| 2020 | $1,258 | $93,952 | $19,998 | $73,954 |
| 2019 | $1,073 | $84,850 | $16,670 | $68,180 |
| 2018 | $1,067 | $75,620 | $16,670 | $58,950 |
| 2017 | $1,033 | $69,850 | $16,670 | $53,180 |
| 2016 | $796 | $69,850 | $0 | $0 |
| 2015 | $796 | $62,040 | $0 | $0 |
| 2014 | $796 | $59,180 | $0 | $0 |
Source: Public Records
Map
Nearby Homes