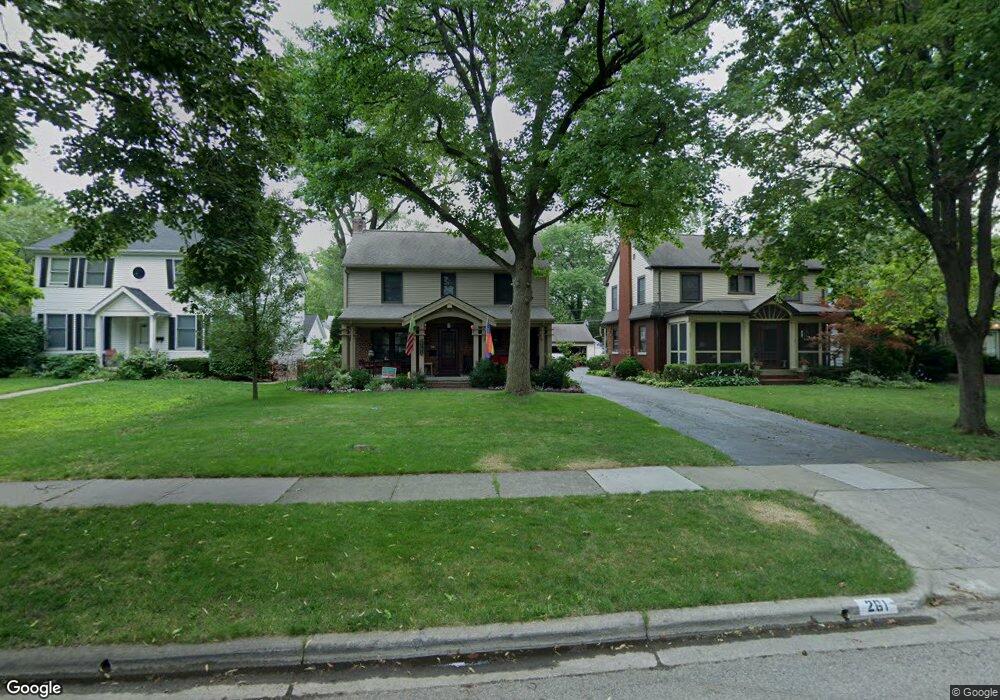
261 N Ardmore Rd Columbus, OH 43209
Estimated Value: $534,000 - $714,000
4
Beds
3
Baths
1,912
Sq Ft
$327/Sq Ft
Est. Value
About This Home
This home is located at 261 N Ardmore Rd, Columbus, OH 43209 and is currently estimated at $624,962, approximately $326 per square foot. 261 N Ardmore Rd is a home located in Franklin County with nearby schools including Maryland Elementary School, Bexley Middle School, and Bexley High School.
Ownership History
Date
Name
Owned For
Owner Type
Purchase Details
Closed on
Apr 25, 2024
Sold by
Looper-Friedman David N and Looper-Friedman Susan E
Bought by
Looper-Friedman David N and Looper-Friedman Susan E
Current Estimated Value
Purchase Details
Closed on
Apr 4, 1995
Sold by
Rgb Venture
Bought by
Friedman David N and Friedman Susan E Looper
Home Financials for this Owner
Home Financials are based on the most recent Mortgage that was taken out on this home.
Original Mortgage
$151,650
Interest Rate
8.91%
Mortgage Type
New Conventional
Purchase Details
Closed on
Aug 16, 1994
Sold by
Unkefer Jack R
Bought by
Rgb Venture
Create a Home Valuation Report for This Property
The Home Valuation Report is an in-depth analysis detailing your home's value as well as a comparison with similar homes in the area
Home Values in the Area
Average Home Value in this Area
Purchase History
| Date | Buyer | Sale Price | Title Company |
|---|---|---|---|
| Looper-Friedman David N | -- | None Listed On Document | |
| Friedman David N | $168,500 | -- | |
| Rgb Venture | $225,000 | -- |
Source: Public Records
Mortgage History
| Date | Status | Borrower | Loan Amount |
|---|---|---|---|
| Previous Owner | Friedman David N | $151,650 |
Source: Public Records
Tax History
| Year | Tax Paid | Tax Assessment Tax Assessment Total Assessment is a certain percentage of the fair market value that is determined by local assessors to be the total taxable value of land and additions on the property. | Land | Improvement |
|---|---|---|---|---|
| 2025 | $10,148 | $182,740 | $61,740 | $121,000 |
| 2024 | $10,148 | $182,740 | $61,740 | $121,000 |
| 2023 | $9,124 | $182,740 | $61,740 | $121,000 |
| 2022 | $9,448 | $151,970 | $42,910 | $109,060 |
| 2021 | $9,455 | $151,970 | $42,910 | $109,060 |
| 2020 | $9,372 | $151,970 | $42,910 | $109,060 |
| 2019 | $8,869 | $126,530 | $35,770 | $90,760 |
| 2018 | $7,164 | $126,530 | $35,770 | $90,760 |
| 2017 | $7,521 | $126,530 | $35,770 | $90,760 |
| 2016 | $6,602 | $101,500 | $24,780 | $76,720 |
| 2015 | $6,621 | $101,500 | $24,780 | $76,720 |
| 2014 | $6,586 | $100,380 | $24,780 | $75,600 |
| 2013 | $3,423 | $100,380 | $24,780 | $75,600 |
Source: Public Records
Map
Nearby Homes
- 343 N Cassady Ave
- 103 N Ardmore Rd
- 2779 Columbus Ave
- 2822 Bellwood Ave
- 2465 E Broad St
- 205 N Gould Rd
- 484 N Parkview Ave
- 161 N Gould Rd
- 125 S Stanwood Rd
- 696 Northview Ave
- 2599 E 5th Ave
- 180 N Harding Rd
- 142 S Gould Rd
- 50 S Chesterfield Rd
- 649 N Nelson Rd Unit A-D
- 2774 Elm Ave
- 271 S Cassingham Rd
- 2996 E 6th Ave
- 57 Preston Rd
- 238 Edgevale Rd
- 267 N Ardmore Rd
- 253 N Ardmore Rd
- 275 N Ardmore Rd
- 247 N Ardmore Rd
- 241 N Ardmore Rd
- 241 N Ardmore Rd
- 281 N Ardmore Rd
- 266 N Cassady Ave
- 272 N Cassady Ave
- 260 N Cassady Ave
- 278 N Cassady Ave
- 252 N Cassady Ave
- 287 N Ardmore Rd
- 235 N Ardmore Rd
- 235 N Ardmore Rd
- 284 N Cassady Ave
- 246 N Cassady Ave
- 256 N Ardmore Rd
- 248 N Ardmore Rd
- 270 N Ardmore Rd
Your Personal Tour Guide
Ask me questions while you tour the home.