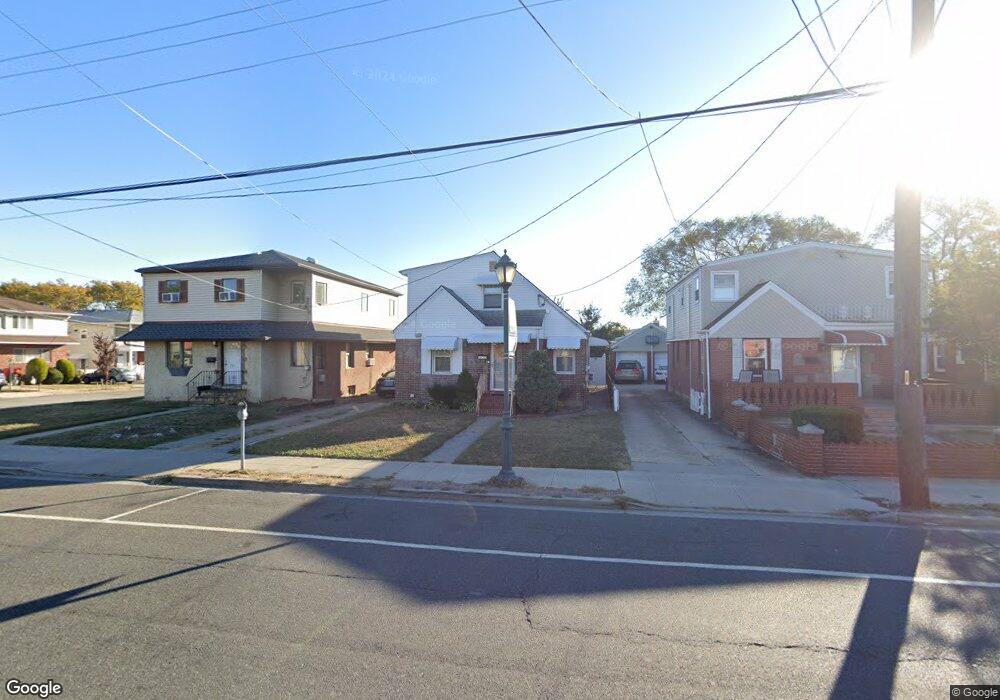
261 N Central Ave Valley Stream, NY 11580
Estimated Value: $790,000 - $801,138
5
Beds
2
Baths
1,810
Sq Ft
$440/Sq Ft
Est. Value
About This Home
This home is located at 261 N Central Ave, Valley Stream, NY 11580 and is currently estimated at $795,569, approximately $439 per square foot. 261 N Central Ave is a home located in Nassau County with nearby schools including Hamza Academy, Valley Stream Christian Academy, and Martin De Porres High School.
Ownership History
Date
Name
Owned For
Owner Type
Purchase Details
Closed on
Oct 25, 2021
Sold by
Ansar Mohammad
Bought by
Bano Saira and Ansar Sidra
Current Estimated Value
Purchase Details
Closed on
May 24, 2016
Sold by
786 Enterprise Of Us Inc
Bought by
Ansar Mohammad
Home Financials for this Owner
Home Financials are based on the most recent Mortgage that was taken out on this home.
Original Mortgage
$360,800
Interest Rate
3.66%
Mortgage Type
New Conventional
Purchase Details
Closed on
Apr 15, 2015
Sold by
Fannie Mae
Bought by
786 Enterprise Of Us Inc
Purchase Details
Closed on
Jun 24, 2014
Sold by
Nationstar Mortgage Llc
Bought by
Federal National Mortgage Association
Purchase Details
Closed on
Apr 3, 2008
Sold by
Recani Inc
Bought by
Welch Marc
Purchase Details
Closed on
Dec 12, 2002
Sold by
Spillane Donald
Create a Home Valuation Report for This Property
The Home Valuation Report is an in-depth analysis detailing your home's value as well as a comparison with similar homes in the area
Home Values in the Area
Average Home Value in this Area
Purchase History
| Date | Buyer | Sale Price | Title Company |
|---|---|---|---|
| Bano Saira | -- | Stewart Title | |
| Ansar Mohammad | $451,000 | Judicial Title Insurance Age | |
| 786 Enterprise Of Us Inc | $290,000 | Judicial Title | |
| Federal National Mortgage Association | $648,689 | None Available | |
| Welch Marc | $480,000 | -- | |
| -- | -- | -- |
Source: Public Records
Mortgage History
| Date | Status | Borrower | Loan Amount |
|---|---|---|---|
| Previous Owner | Ansar Mohammad | $360,800 |
Source: Public Records
Tax History
| Year | Tax Paid | Tax Assessment Tax Assessment Total Assessment is a certain percentage of the fair market value that is determined by local assessors to be the total taxable value of land and additions on the property. | Land | Improvement |
|---|---|---|---|---|
| 2025 | $10,812 | $516 | $181 | $335 |
| 2024 | $2,103 | $531 | $188 | $343 |
Source: Public Records
Map
Nearby Homes
- 257 N Central Ave
- 253 N Central Ave
- 36 Haven Ave
- 249 N Central Ave
- 32 Haven Ave
- 5 Raisig Ave
- 9 Raisig Ave
- 28 Haven Ave
- 46 Haven Ave
- 245 N Central Ave
- 245 N Central Ave Unit W. H.
- 24 Haven Ave
- 20 Haven Ave
- 241 N Central Ave
- 242 N Central Ave
- 289 N Central Ave Unit 1st Fl
- 289 N Central Ave Unit 1st Fl
- 282 N Central Ave Unit 2
- 282 N Central Ave Unit 1
- 282 N Central Ave
Your Personal Tour Guide
Ask me questions while you tour the home.