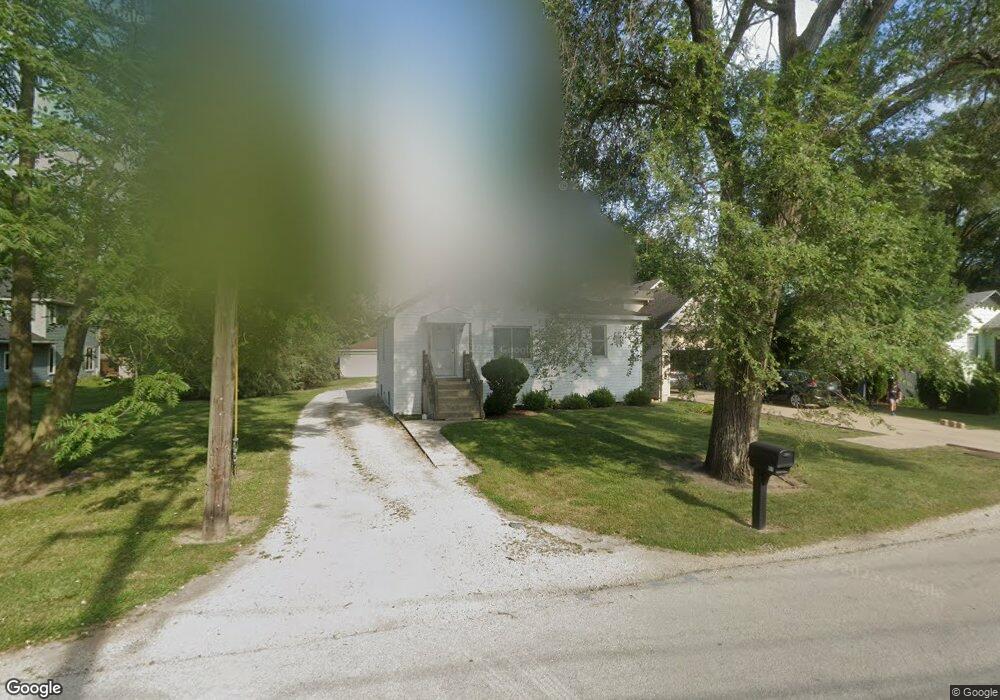
261 N Grant St Westmont, IL 60559
North Westmont NeighborhoodEstimated Value: $282,000 - $345,000
--
Bed
--
Bath
954
Sq Ft
$337/Sq Ft
Est. Value
About This Home
This home is located at 261 N Grant St, Westmont, IL 60559 and is currently estimated at $321,622, approximately $337 per square foot. 261 N Grant St is a home located in DuPage County with nearby schools including C E Miller Elementary School, J T Manning Elementary School, and Westmont Jr High School.
Ownership History
Date
Name
Owned For
Owner Type
Purchase Details
Closed on
Jun 17, 1994
Sold by
Butler Carl L and Butler Bernadette
Bought by
Smith David A and Smith Kelly A
Current Estimated Value
Home Financials for this Owner
Home Financials are based on the most recent Mortgage that was taken out on this home.
Original Mortgage
$122,751
Interest Rate
8.58%
Mortgage Type
FHA
Purchase Details
Closed on
Dec 15, 1993
Sold by
Mendelsohn Robert W
Bought by
Butler Carl L and Butler Bernadette
Create a Home Valuation Report for This Property
The Home Valuation Report is an in-depth analysis detailing your home's value as well as a comparison with similar homes in the area
Home Values in the Area
Average Home Value in this Area
Purchase History
| Date | Buyer | Sale Price | Title Company |
|---|---|---|---|
| Smith David A | $124,000 | Intercounty Title Company | |
| Butler Carl L | $67,500 | Intercounty Title Company |
Source: Public Records
Mortgage History
| Date | Status | Borrower | Loan Amount |
|---|---|---|---|
| Closed | Smith David A | $122,751 |
Source: Public Records
Tax History Compared to Growth
Tax History
| Year | Tax Paid | Tax Assessment Tax Assessment Total Assessment is a certain percentage of the fair market value that is determined by local assessors to be the total taxable value of land and additions on the property. | Land | Improvement |
|---|---|---|---|---|
| 2024 | $4,482 | $76,962 | $31,035 | $45,927 |
| 2023 | $4,212 | $70,750 | $28,530 | $42,220 |
| 2022 | $4,099 | $67,330 | $27,150 | $40,180 |
| 2021 | $3,936 | $66,560 | $26,840 | $39,720 |
| 2020 | $3,850 | $65,240 | $26,310 | $38,930 |
| 2019 | $3,709 | $62,590 | $25,240 | $37,350 |
| 2018 | $3,282 | $54,800 | $25,120 | $29,680 |
| 2017 | $3,184 | $52,730 | $24,170 | $28,560 |
| 2016 | $3,121 | $50,330 | $23,070 | $27,260 |
| 2015 | $3,054 | $47,350 | $21,700 | $25,650 |
| 2014 | $3,044 | $46,040 | $21,100 | $24,940 |
| 2013 | $2,987 | $47,480 | $21,030 | $26,450 |
Source: Public Records
Map
Nearby Homes
- 108 W Naperville Rd
- 124 W Naperville Rd
- 303 N Cass Ave
- 260 N Linden Ave
- 500 N Grant St
- 242 N Wilmette Ave
- 475 N Cass Ave Unit 212
- 25 N Washington St
- 14 Mohawk Dr
- 113 Mohawk Dr
- 27 Indian Dr
- 4107 N Park St
- 527 Cumnor Rd Unit 107W
- 4831 Florence Ave
- 214 Woodstock Ave
- 4022 N Grant St
- 403 Burlington Ave
- 4018 N Grant St
- 206 S Adams St
- 312 Prairie Ave
- 259 N Grant St
- 302 N Grant St
- 257 N Grant St
- 303 N Grant St
- 255 N Grant St
- 305 N Grant St
- 258 N Grant St
- 300 N Grant St
- 300 N Lincoln St
- 307 N Grant St
- 302 N Lincoln St
- 309 N Grant St
- 304 N Grant St
- 107 W Chicago Ave
- 304 N Lincoln St
- 114 W Chicago Ave
- 306 N Lincoln St
- 311 N Grant St
- 12 W Naperville Rd
- 111 W Chicago Ave