Estimated Value: $168,000 - $208,000
2
Beds
1
Bath
1,533
Sq Ft
$120/Sq Ft
Est. Value
About This Home
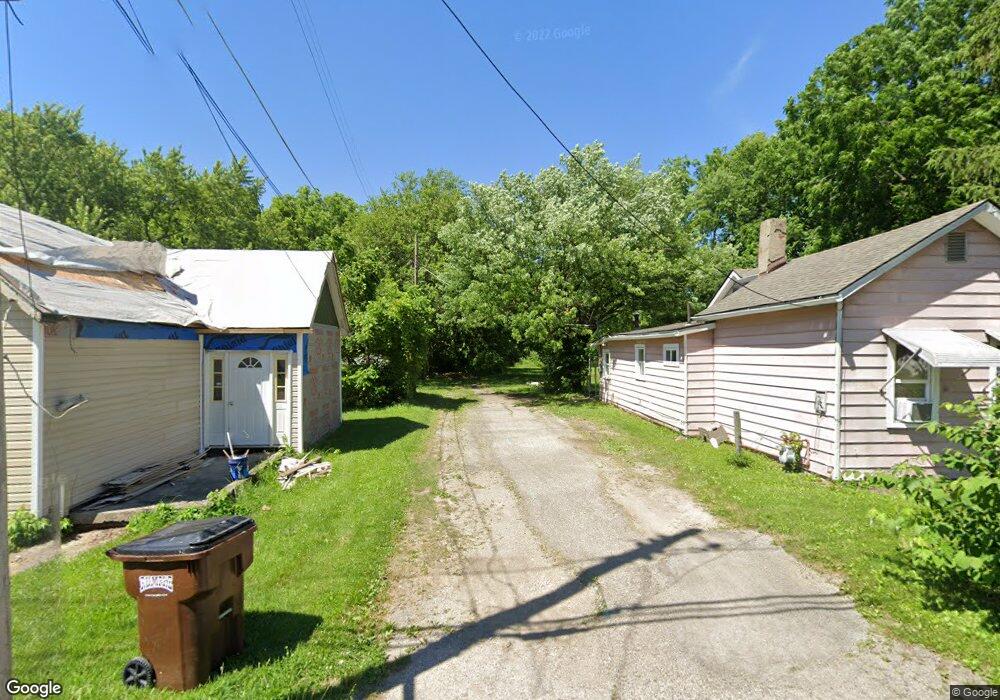
This home is located at 261 N West St, Xenia, OH 45385 and is currently estimated at $183,761, approximately $119 per square foot. 261 N West St is a home located in Greene County with nearby schools including Xenia High School, Summit Academy Community School for Alternative Learners - Xenia, and Legacy Christian Academy.
Ownership History
Date
Name
Owned For
Owner Type
Purchase Details
Closed on
Feb 15, 2022
Sold by
Unknown
Bought by
Tarbox Alex
Current Estimated Value
Home Financials for this Owner
Home Financials are based on the most recent Mortgage that was taken out on this home.
Original Mortgage
$139,918
Outstanding Balance
$129,656
Interest Rate
3.69%
Mortgage Type
FHA
Estimated Equity
$54,105
Purchase Details
Closed on
Sep 30, 2011
Sold by
Scheerschmidt Fred I and Scheerschmidt Joyce A
Bought by
Fields Kasee B and Ault Bradley H
Home Financials for this Owner
Home Financials are based on the most recent Mortgage that was taken out on this home.
Original Mortgage
$63,352
Interest Rate
4.4%
Mortgage Type
FHA
Purchase Details
Closed on
Oct 18, 1999
Sold by
Scheerschmidt Fred I and Scheerschmidt Joyce A
Bought by
Scheerschmidt Fred I and Scheerschmidt Joyce A
Create a Home Valuation Report for This Property
The Home Valuation Report is an in-depth analysis detailing your home's value as well as a comparison with similar homes in the area
Home Values in the Area
Average Home Value in this Area
Purchase History
| Date | Buyer | Sale Price | Title Company |
|---|---|---|---|
| Tarbox Alex | -- | Chicago Title | |
| Fields Kasee B | $65,000 | Attorney | |
| Scheerschmidt Fred I | -- | -- |
Source: Public Records
Mortgage History
| Date | Status | Borrower | Loan Amount |
|---|---|---|---|
| Open | Tarbox Alex | $139,918 | |
| Previous Owner | Fields Kasee B | $63,352 |
Source: Public Records
Tax History Compared to Growth
Tax History
| Year | Tax Paid | Tax Assessment Tax Assessment Total Assessment is a certain percentage of the fair market value that is determined by local assessors to be the total taxable value of land and additions on the property. | Land | Improvement |
|---|---|---|---|---|
| 2024 | $1,754 | $40,990 | $3,740 | $37,250 |
| 2023 | $1,754 | $40,990 | $3,740 | $37,250 |
| 2022 | $1,502 | $29,940 | $2,340 | $27,600 |
| 2021 | $1,522 | $29,940 | $2,340 | $27,600 |
| 2020 | $1,458 | $29,940 | $2,340 | $27,600 |
| 2019 | $1,048 | $20,260 | $2,890 | $17,370 |
| 2018 | $1,052 | $20,260 | $2,890 | $17,370 |
| 2017 | $1,072 | $20,260 | $2,890 | $17,370 |
| 2016 | $1,073 | $20,260 | $2,890 | $17,370 |
| 2015 | $1,076 | $20,260 | $2,890 | $17,370 |
| 2014 | $1,030 | $20,260 | $2,890 | $17,370 |
Source: Public Records
Map
Nearby Homes