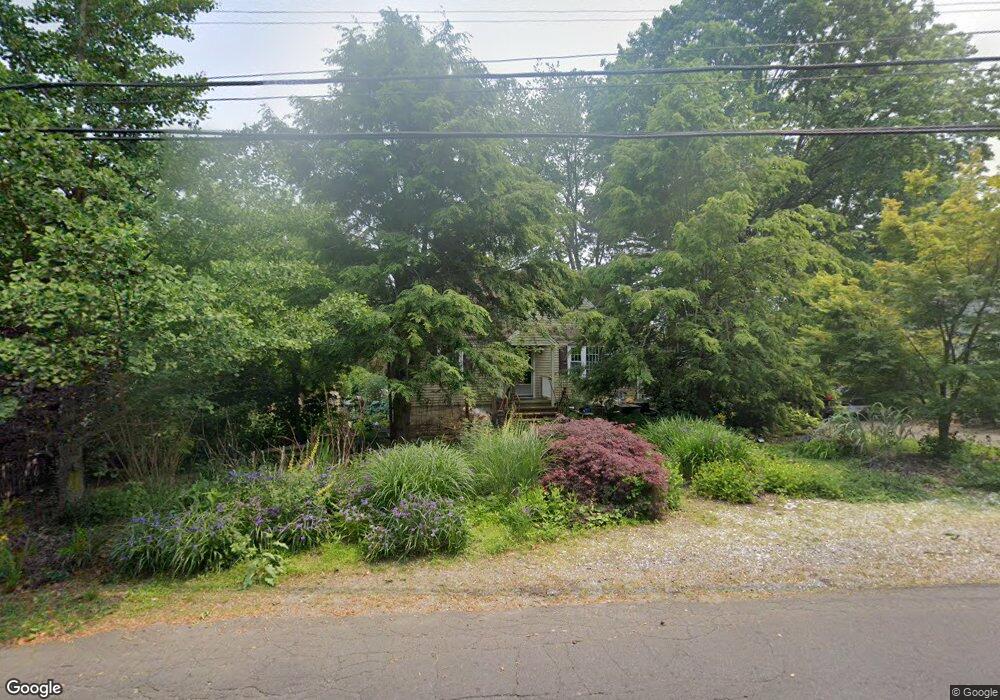
261 Reid St Fairfield, CT 06824
University NeighborhoodEstimated Value: $538,000 - $831,000
4
Beds
2
Baths
1,075
Sq Ft
$623/Sq Ft
Est. Value
About This Home
This home is located at 261 Reid St, Fairfield, CT 06824 and is currently estimated at $670,169, approximately $623 per square foot. 261 Reid St is a home located in Fairfield County with nearby schools including Holland Hill Elementary, Fairfield Woods Middle School, and Fairfield Ludlowe High School.
Ownership History
Date
Name
Owned For
Owner Type
Purchase Details
Closed on
Jun 24, 2009
Sold by
Ward Steven and Ward Raymond P
Bought by
Ward David
Current Estimated Value
Home Financials for this Owner
Home Financials are based on the most recent Mortgage that was taken out on this home.
Original Mortgage
$250,000
Interest Rate
4.92%
Create a Home Valuation Report for This Property
The Home Valuation Report is an in-depth analysis detailing your home's value as well as a comparison with similar homes in the area
Home Values in the Area
Average Home Value in this Area
Purchase History
| Date | Buyer | Sale Price | Title Company |
|---|---|---|---|
| Ward David | $150,000 | -- | |
| Ward David | $150,000 | -- |
Source: Public Records
Mortgage History
| Date | Status | Borrower | Loan Amount |
|---|---|---|---|
| Open | Ward David | $37,500 | |
| Open | Ward David | $247,000 | |
| Closed | Ward David | $250,000 |
Source: Public Records
Tax History Compared to Growth
Tax History
| Year | Tax Paid | Tax Assessment Tax Assessment Total Assessment is a certain percentage of the fair market value that is determined by local assessors to be the total taxable value of land and additions on the property. | Land | Improvement |
|---|---|---|---|---|
| 2025 | $8,124 | $286,160 | $236,250 | $49,910 |
| 2024 | $7,984 | $286,160 | $236,250 | $49,910 |
| 2023 | $7,872 | $286,160 | $236,250 | $49,910 |
| 2022 | $7,795 | $286,160 | $236,250 | $49,910 |
| 2021 | $7,721 | $286,160 | $236,250 | $49,910 |
| 2020 | $6,541 | $244,160 | $194,040 | $50,120 |
| 2019 | $6,541 | $244,160 | $194,040 | $50,120 |
| 2018 | $6,436 | $244,160 | $194,040 | $50,120 |
| 2017 | $6,304 | $244,160 | $194,040 | $50,120 |
| 2016 | $6,214 | $244,160 | $194,040 | $50,120 |
| 2015 | $6,113 | $246,610 | $205,800 | $40,810 |
| 2014 | $6,017 | $246,610 | $205,800 | $40,810 |
Source: Public Records
Map
Nearby Homes
- 359 Reid St
- 42 Robin Cir
- 115 Mayfair Rd
- 293 Sigwin Dr
- 12 Sugar Plum Ln
- 41 Pepperbush Ln
- 2107 N Benson Rd
- 706 Judd St
- 1207 Stillson Rd
- 109 Jeniford Rd
- 288 Melody Ln
- 28 Stillson Place
- 210 Pansy Rd
- 338 Orchard Hill Ln
- 378 High St
- 108 Roseville St
- 245 Sunnyridge Ave Unit 33
- 274 High St
- 33 Middlebrook Place
- 17 Hazel St