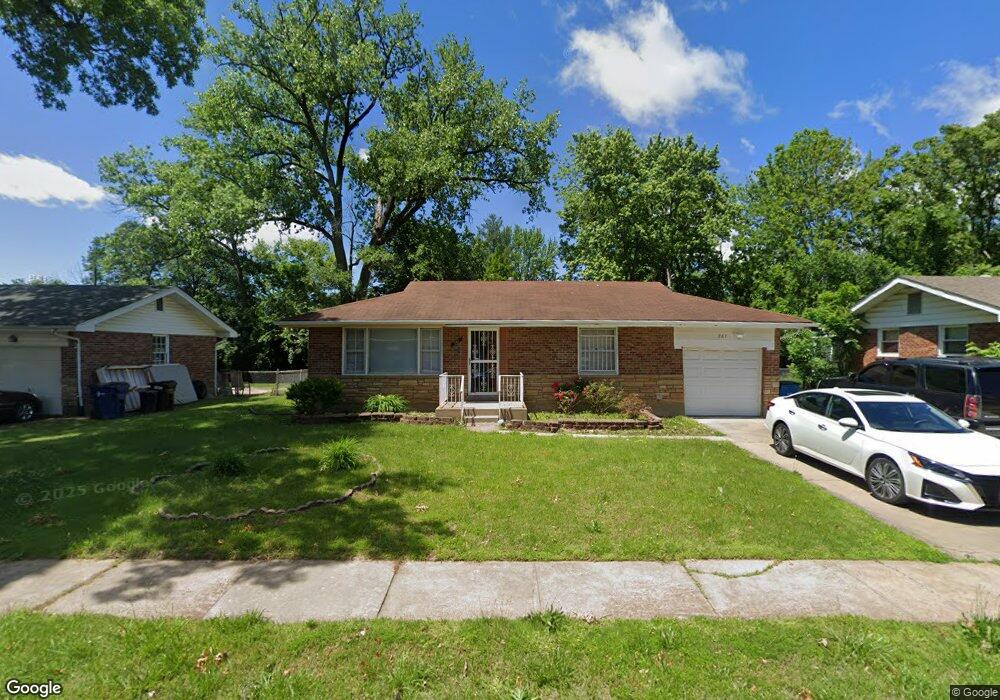
261 Royce Dr Saint Louis, MO 63135
Estimated Value: $113,000 - $126,000
2
Beds
2
Baths
1,295
Sq Ft
$91/Sq Ft
Est. Value
About This Home
This home is located at 261 Royce Dr, Saint Louis, MO 63135 and is currently estimated at $118,157, approximately $91 per square foot. 261 Royce Dr is a home located in St. Louis County with nearby schools including Griffith Elementary School, Ferguson Middle School, and McCluer High School.
Ownership History
Date
Name
Owned For
Owner Type
Purchase Details
Closed on
Jun 17, 2004
Sold by
Jones Ella M and Jones Timothy
Bought by
Emerson Shirley and Emerson Elizabeth
Current Estimated Value
Home Financials for this Owner
Home Financials are based on the most recent Mortgage that was taken out on this home.
Original Mortgage
$83,242
Outstanding Balance
$41,508
Interest Rate
6.3%
Mortgage Type
FHA
Estimated Equity
$76,649
Purchase Details
Closed on
Feb 21, 2001
Sold by
Jones Ella M and Jones Timothy
Bought by
Jones Timothy and Jones Ella M
Create a Home Valuation Report for This Property
The Home Valuation Report is an in-depth analysis detailing your home's value as well as a comparison with similar homes in the area
Home Values in the Area
Average Home Value in this Area
Purchase History
| Date | Buyer | Sale Price | Title Company |
|---|---|---|---|
| Emerson Shirley | $83,900 | -- | |
| Jones Timothy | -- | -- |
Source: Public Records
Mortgage History
| Date | Status | Borrower | Loan Amount |
|---|---|---|---|
| Open | Emerson Shirley | $83,242 |
Source: Public Records
Tax History
| Year | Tax Paid | Tax Assessment Tax Assessment Total Assessment is a certain percentage of the fair market value that is determined by local assessors to be the total taxable value of land and additions on the property. | Land | Improvement |
|---|---|---|---|---|
| 2025 | $1,489 | $24,250 | $2,360 | $21,890 |
| 2024 | $1,489 | $20,500 | $1,580 | $18,920 |
| 2023 | $1,481 | $20,500 | $1,580 | $18,920 |
| 2022 | $1,156 | $13,880 | $3,140 | $10,740 |
| 2021 | $1,119 | $13,880 | $3,140 | $10,740 |
| 2020 | $1,106 | $12,320 | $1,620 | $10,700 |
| 2019 | $1,085 | $12,320 | $1,620 | $10,700 |
| 2018 | $1,165 | $11,820 | $950 | $10,870 |
| 2017 | $1,142 | $11,820 | $950 | $10,870 |
| 2016 | $1,049 | $10,660 | $1,670 | $8,990 |
Source: Public Records
Map
Nearby Homes
- 315 S Dellwood Dr
- 211 S Dellwood Dr
- 312 Ward Dr
- 277 Dashwood Dr
- 945 Edgehill Dr
- 63 S Dellwood Ave
- 324 Gage Dr
- 296 Meadowcrest Dr
- 125 Forestwood Dr
- 1325 Kappel Dr
- 227 Meadowcrest Dr
- 9619 Perch Dr
- 100 Florwood Ct
- 33 S Schlueter Ave
- 33 S Dellwood Ave
- 216 S Hartnett Ave
- 1523 Fir Dr
- 269 S Barat Ave
- 9713 Dennis Dr
- 253 S Barat Ave
Your Personal Tour Guide
Ask me questions while you tour the home.