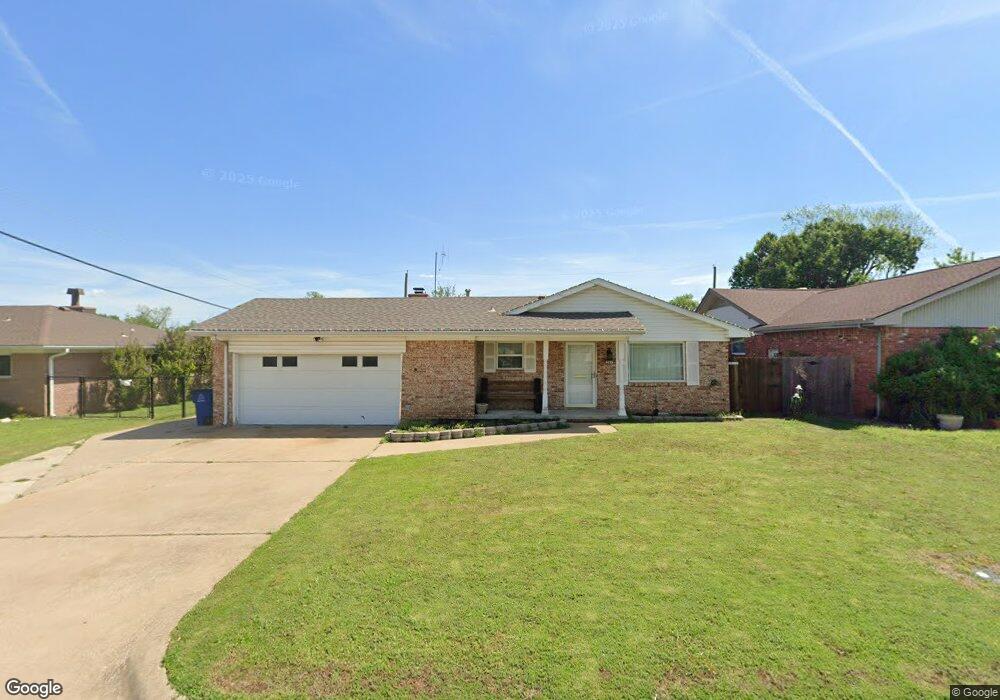
261 S 118th Ave E Tulsa, OK 74128
Western Village NeighborhoodEstimated Value: $173,000 - $202,000
--
Bed
2
Baths
1,302
Sq Ft
$144/Sq Ft
Est. Value
About This Home
This home is located at 261 S 118th Ave E, Tulsa, OK 74128 and is currently estimated at $187,928, approximately $144 per square foot. 261 S 118th Ave E is a home located in Tulsa County with nearby schools including Kerr Elementary School, East Central High School, and Wright Christian Academy.
Ownership History
Date
Name
Owned For
Owner Type
Purchase Details
Closed on
Oct 14, 2024
Sold by
Valles Nelson A Gonzalez and Gonzalez Milipza
Bought by
Carballo Efren Briceno
Current Estimated Value
Home Financials for this Owner
Home Financials are based on the most recent Mortgage that was taken out on this home.
Original Mortgage
$6,254
Outstanding Balance
$4,278
Interest Rate
6.32%
Mortgage Type
New Conventional
Estimated Equity
$183,650
Purchase Details
Closed on
Apr 3, 2018
Sold by
Miles George
Bought by
Golzalez Valles Nelson A
Home Financials for this Owner
Home Financials are based on the most recent Mortgage that was taken out on this home.
Original Mortgage
$84,932
Interest Rate
4.46%
Mortgage Type
FHA
Purchase Details
Closed on
Mar 29, 2018
Sold by
Miles George M and Ryan Frank T
Bought by
Miles George M
Home Financials for this Owner
Home Financials are based on the most recent Mortgage that was taken out on this home.
Original Mortgage
$84,932
Interest Rate
4.46%
Mortgage Type
FHA
Purchase Details
Closed on
Dec 1, 1995
Create a Home Valuation Report for This Property
The Home Valuation Report is an in-depth analysis detailing your home's value as well as a comparison with similar homes in the area
Home Values in the Area
Average Home Value in this Area
Purchase History
| Date | Buyer | Sale Price | Title Company |
|---|---|---|---|
| Carballo Efren Briceno | $182,000 | None Listed On Document | |
| Golzalez Valles Nelson A | $86,500 | First American Title | |
| Miles George M | -- | None Available | |
| -- | $59,500 | -- |
Source: Public Records
Mortgage History
| Date | Status | Borrower | Loan Amount |
|---|---|---|---|
| Open | Carballo Efren Briceno | $6,254 | |
| Open | Carballo Efren Briceno | $178,703 | |
| Previous Owner | Golzalez Valles Nelson A | $84,932 |
Source: Public Records
Tax History Compared to Growth
Tax History
| Year | Tax Paid | Tax Assessment Tax Assessment Total Assessment is a certain percentage of the fair market value that is determined by local assessors to be the total taxable value of land and additions on the property. | Land | Improvement |
|---|---|---|---|---|
| 2024 | $1,331 | $11,015 | $1,489 | $9,526 |
| 2023 | $1,331 | $10,490 | $1,431 | $9,059 |
| 2022 | $1,332 | $9,991 | $1,987 | $8,004 |
| 2021 | $1,257 | $9,515 | $1,892 | $7,623 |
| 2020 | $1,240 | $9,515 | $1,892 | $7,623 |
| 2019 | $1,304 | $9,515 | $1,892 | $7,623 |
| 2018 | $1,147 | $8,351 | $1,524 | $6,827 |
| 2017 | $0 | $7,953 | $1,452 | $6,501 |
| 2016 | $0 | $7,953 | $1,452 | $6,501 |
| 2015 | -- | $8,261 | $1,892 | $6,369 |
| 2014 | -- | $8,261 | $1,892 | $6,369 |
Source: Public Records
Map
Nearby Homes
- 244 S 120th East Ave
- 11726 E 7th St
- 11333 E 6th St
- 10931 E 4th Place
- 527 S 108th East Ave
- 133 S 107th East Ave
- 610 S 108th East Ave
- 10611 E 4th Place
- 0 E 11th St S Unit 2529262
- 617 S 106th East Ave
- 106 S 111th East Ave
- 0 East Ave Unit 2501591
- 11031 E 11th Place Unit 31A
- 11010 E 13th St Unit 48
- 11003 E 13th St Unit 40-2C
- 1120 S 110th Ave E Unit 12-2C
- 1201 S 110th East Ave Unit 1A
- 1216 S 111th East Ave Unit 43
- 241 S 104th East Ave
- 1227 S 110th East Ave Unit 39C
- 267 S 118th East Ave
- 255 S 118th East Ave
- 273 S 118th East Ave
- 304 S 119th East Ave
- 249 S 118th East Ave
- 310 S 119th East Ave
- 262 S 118th East Ave
- 238 S 119th East Ave
- 268 S 118th East Ave
- 258 S 118th East Ave
- 314 S 119th East Ave
- 279 S 118th East Ave
- 232 S 119th East Ave
- 274 S 118th East Ave
- 252 S 118th East Ave
- 243 S 118th East Ave
- 320 S 119th East Ave
- 278 S 118th East Ave
- 285 S 118th East Ave
- 246 S 118th East Ave