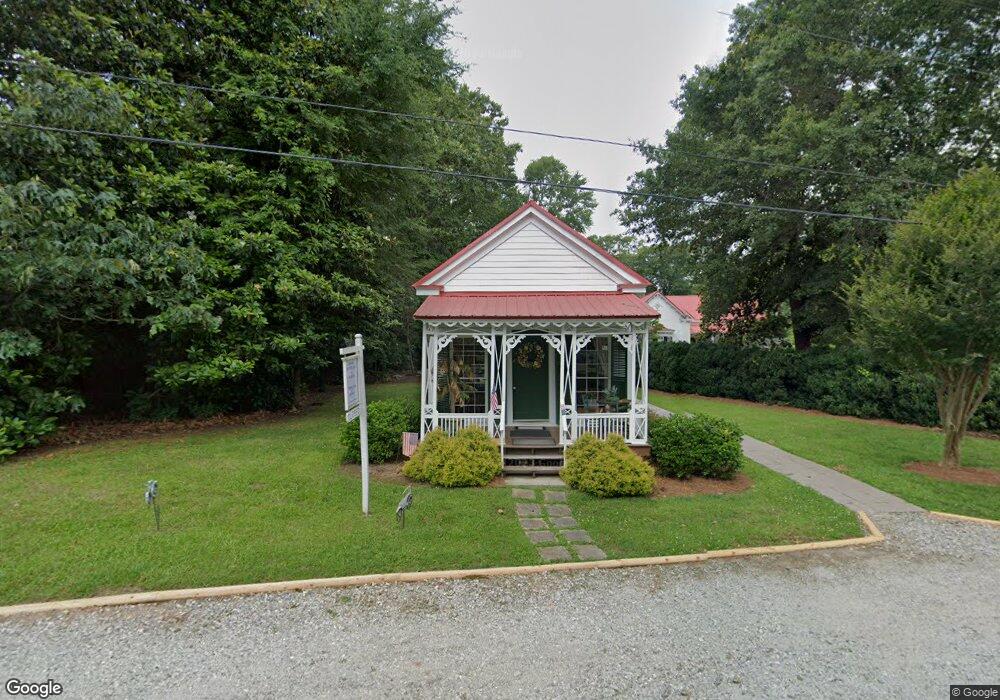
261 S Main St Stephens, GA 30667
Estimated Value: $336,000 - $489,000
4
Beds
2
Baths
2,914
Sq Ft
$141/Sq Ft
Est. Value
About This Home
This home is located at 261 S Main St, Stephens, GA 30667 and is currently estimated at $410,985, approximately $141 per square foot. 261 S Main St is a home with nearby schools including Oglethorpe County Primary School, Oglethorpe County Elementary School, and Oglethorpe County Middle School.
Ownership History
Date
Name
Owned For
Owner Type
Purchase Details
Closed on
May 6, 2024
Sold by
Buchanan Charles Jeffrey
Bought by
Buchanan Charles Jeffrey
Current Estimated Value
Purchase Details
Closed on
Oct 5, 2020
Sold by
Short Dennis W
Bought by
Callahan Shirley Johnson and Callahan Larry Paul
Home Financials for this Owner
Home Financials are based on the most recent Mortgage that was taken out on this home.
Original Mortgage
$276,000
Interest Rate
2.9%
Mortgage Type
New Conventional
Purchase Details
Closed on
Dec 22, 2012
Sold by
F & M Bank
Bought by
Short Dennis W and Faye Short L
Purchase Details
Closed on
Dec 11, 2012
Sold by
F & M Bank
Bought by
F & M Bank
Purchase Details
Closed on
Oct 4, 2011
Sold by
F & M Bank
Bought by
F & M Bank
Purchase Details
Closed on
Oct 2, 2002
Sold by
Hatfield Larry L and Hatfield Carol W
Bought by
Pettay Kenneth A and Petta Rosalind J
Purchase Details
Closed on
Mar 1, 1999
Sold by
Hatfield Larry L
Bought by
Hatfield Larry L and Hatfield C
Create a Home Valuation Report for This Property
The Home Valuation Report is an in-depth analysis detailing your home's value as well as a comparison with similar homes in the area
Purchase History
| Date | Buyer | Sale Price | Title Company |
|---|---|---|---|
| Buchanan Charles Jeffrey | -- | -- | |
| Callahan Shirley Johnson | $375,000 | -- | |
| Short Dennis W | $130,000 | -- | |
| F & M Bank | -- | -- | |
| F & M Bank | -- | -- | |
| Pettay Kenneth A | $230,000 | -- | |
| Hatfield Larry L | -- | -- |
Source: Public Records
Mortgage History
| Date | Status | Borrower | Loan Amount |
|---|---|---|---|
| Previous Owner | Callahan Shirley Johnson | $276,000 |
Source: Public Records
Tax History
| Year | Tax Paid | Tax Assessment Tax Assessment Total Assessment is a certain percentage of the fair market value that is determined by local assessors to be the total taxable value of land and additions on the property. | Land | Improvement |
|---|---|---|---|---|
| 2025 | $489 | $142,840 | $12,440 | $130,400 |
| 2023 | $294 | $138,264 | $9,440 | $128,824 |
| 2022 | $2,999 | $114,100 | $9,440 | $104,660 |
| 2021 | $2,546 | $89,060 | $5,480 | $83,580 |
| 2020 | $1,905 | $89,060 | $5,480 | $83,580 |
| 2019 | $2,516 | $89,060 | $5,480 | $83,580 |
| 2018 | $2,164 | $71,686 | $4,296 | $67,390 |
| 2017 | $2,110 | $71,686 | $4,296 | $67,390 |
| 2016 | $1,674 | $58,482 | $4,296 | $54,186 |
| 2015 | -- | $58,482 | $4,296 | $54,186 |
| 2014 | -- | $53,262 | $4,296 | $48,966 |
| 2013 | -- | $53,261 | $4,296 | $48,965 |
Source: Public Records
Map
Nearby Homes
- 290 Poplar Creek Rd
- 181 Lower Wirebridge Rd
- 0 Lower Wirebridge Rd
- 0 Lovers Ln Unit 10690740
- 0 Lovers Ln Unit CL349036
- 1774 Union Point Rd
- 1500 Churchwell Rd
- 0 Bull Bray Rd
- 5011 Penfield Rd
- 1101 Boswell Rd
- 5971 Penfield Rd
- 0 Crawfordville Rd Unit 10674081
- 0 Crawfordville Rd Unit CL346865
- 1000 Nichols Rd
- 0 Woodville Rd Unit 7667944
- 0 Woodville Rd Unit 10628010
- 0 Crawfordville Rd Unit 26194777
- 0 Crawfordville Rd Unit 26541703
- 0 Nichols Unit 26436706
- 1091 Peachtree Ave E
- 261 N Main St
- 357 N Main St
- 369 N Main St
- 0 Union Point Rd Unit 8103861
- 0 Union Point Rd Unit CM953264
- 0 Union Point Rd Unit 10410589
- 344 N Main St
- 0 Georgia 77
- 0 Laurel Lane & Union Point Rd
- 0 Laurel Ln Unit 7165133
- 0 Laurel Ln Unit 10123745
- 0 Laurel Ln Unit 10072019
- 0 Laurel Ln Unit 7084861
- 110 Sunset Dr
- 344 S Main St
- 168 Sunset Dr
- 399 S Main St
- 435 N Main St
- 435 S Main St
- 1021 Dogwood Rd S
Your Personal Tour Guide
Ask me questions while you tour the home.