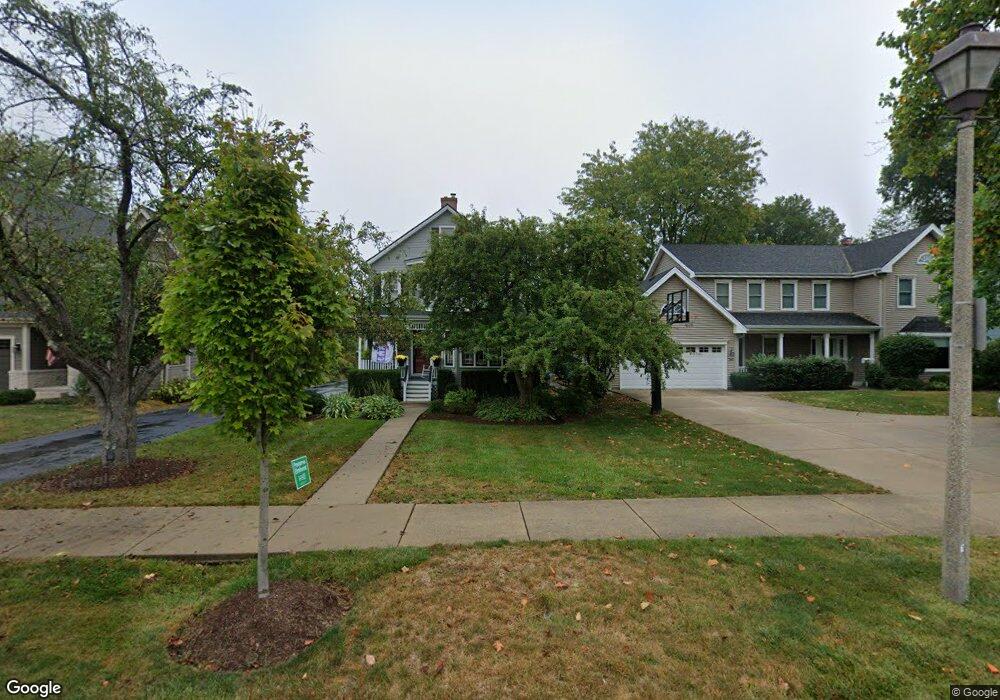
261 S York St Elmhurst, IL 60126
--
Bed
--
Bath
7,432
Sq Ft
8,276
Sq Ft Lot
About This Home
This home is located at 261 S York St, Elmhurst, IL 60126. 261 S York St is a home located in DuPage County with nearby schools including Hawthorne Elementary School, Edison Elementary School, and Sandburg Middle School.
Ownership History
Date
Name
Owned For
Owner Type
Purchase Details
Closed on
May 7, 2014
Sold by
Melrose Holdings 2 Llc
Bought by
261-263 N York Llc
Home Financials for this Owner
Home Financials are based on the most recent Mortgage that was taken out on this home.
Original Mortgage
$1,700,000
Interest Rate
4.41%
Mortgage Type
Commercial
Purchase Details
Closed on
Mar 15, 2013
Sold by
Lomnicki Family Llc
Bought by
Melrose Holdings 2 Llc
Purchase Details
Closed on
Jan 19, 2009
Sold by
Lomnicki Family Llc
Bought by
Lomnicki Dolores and Dolores Lomnicki Trust
Purchase Details
Closed on
Jan 4, 2001
Sold by
West Suburban Bank
Bought by
Lomnicki Family Llc
Create a Home Valuation Report for This Property
The Home Valuation Report is an in-depth analysis detailing your home's value as well as a comparison with similar homes in the area
Home Values in the Area
Average Home Value in this Area
Purchase History
| Date | Buyer | Sale Price | Title Company |
|---|---|---|---|
| 261-263 N York Llc | $1,300,000 | Ctic Dupage | |
| Melrose Holdings 2 Llc | -- | None Available | |
| Lomnicki Dolores | -- | None Available | |
| Lomnicki Family Llc | -- | -- |
Source: Public Records
Mortgage History
| Date | Status | Borrower | Loan Amount |
|---|---|---|---|
| Closed | 261-263 N York Llc | $1,700,000 |
Source: Public Records
Tax History Compared to Growth
Tax History
| Year | Tax Paid | Tax Assessment Tax Assessment Total Assessment is a certain percentage of the fair market value that is determined by local assessors to be the total taxable value of land and additions on the property. | Land | Improvement |
|---|---|---|---|---|
| 2024 | $19,198 | $247,597 | $107,383 | $140,214 |
| 2023 | $17,719 | $228,960 | $99,300 | $129,660 |
| 2022 | $16,886 | $217,890 | $94,500 | $123,390 |
| 2021 | $16,410 | $212,470 | $92,150 | $120,320 |
| 2020 | $15,843 | $207,810 | $90,130 | $117,680 |
| 2019 | $15,473 | $197,570 | $85,690 | $111,880 |
| 2018 | $14,862 | $187,020 | $81,110 | $105,910 |
| 2017 | $14,534 | $178,210 | $77,290 | $100,920 |
| 2016 | $14,108 | $167,880 | $72,810 | $95,070 |
| 2015 | $13,611 | $156,400 | $67,830 | $88,570 |
| 2014 | $12,360 | $131,050 | $63,990 | $67,060 |
| 2013 | $24,601 | $267,330 | $64,890 | $202,440 |
Source: Public Records
Map
Nearby Homes
- 211 N Hwy N
- 145 S York St Unit 322
- 145 S York St Unit 404
- 153 S Kenmore Ave
- 219 E Saint Charles Rd
- 105 S Cottage Hill Ave Unit 304
- 187 E Orchard St
- 377 S Prairie Ave
- 279 S Poplar Ave
- 333 E Huntington Ln
- 110 N Pine St
- 224 E May St
- 500 S Kenilworth Ave
- 201 E Schiller St
- 128 S Linden Ave
- 104 Evergreen Ave
- 15 Manchester Ln
- 28 Windsor Dr
- 130 S Elm Tree Ln
- 195 N Addison Ave Unit PH03
- 265 S York St
- 273 S York St
- 259 S York St
- 281 S York St
- 270 S York St
- 266 S York St
- 253 S York St
- 285 S York St
- 111 W Elmwood Terrace
- 251 S York St
- 258 S York St
- 264 S Kenilworth Ave
- 254 S Kenilworth Ave
- 110 W Church St
- 289 S York St
- 270 S Kenilworth Ave
- 245 S York St
- 276 S Kenilworth Ave
- 111 E Adelia St
- 117 W Elmwood Terrace