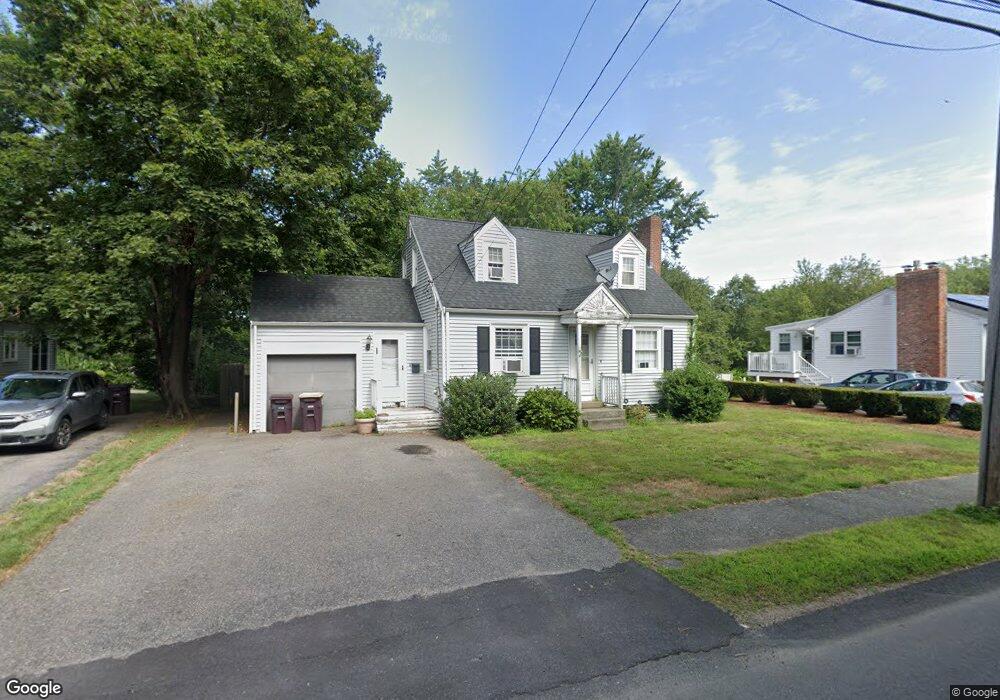
261 Summer St Weymouth, MA 02188
Weymouth Landing NeighborhoodEstimated Value: $441,000 - $600,000
--
Bed
1
Bath
1,092
Sq Ft
$485/Sq Ft
Est. Value
About This Home
This home is located at 261 Summer St, Weymouth, MA 02188 and is currently estimated at $529,908, approximately $485 per square foot. 261 Summer St is a home located in Norfolk County with nearby schools including Frederick C Murphy, Abigail Adams Middle School, and Weymouth Middle School Chapman.
Ownership History
Date
Name
Owned For
Owner Type
Purchase Details
Closed on
Oct 2, 2014
Sold by
Burns Amy E and Rogers Amy
Bought by
Rogers Amy
Current Estimated Value
Home Financials for this Owner
Home Financials are based on the most recent Mortgage that was taken out on this home.
Original Mortgage
$259,462
Outstanding Balance
$197,218
Interest Rate
3.87%
Mortgage Type
FHA
Estimated Equity
$332,690
Purchase Details
Closed on
Jun 27, 2001
Sold by
Burns John E
Bought by
Burns Amy E
Home Financials for this Owner
Home Financials are based on the most recent Mortgage that was taken out on this home.
Original Mortgage
$121,600
Interest Rate
7.14%
Mortgage Type
Purchase Money Mortgage
Create a Home Valuation Report for This Property
The Home Valuation Report is an in-depth analysis detailing your home's value as well as a comparison with similar homes in the area
Home Values in the Area
Average Home Value in this Area
Purchase History
| Date | Buyer | Sale Price | Title Company |
|---|---|---|---|
| Rogers Amy | -- | -- | |
| Burns Amy E | $152,000 | -- |
Source: Public Records
Mortgage History
| Date | Status | Borrower | Loan Amount |
|---|---|---|---|
| Open | Rogers Amy | $259,462 | |
| Previous Owner | Burns Amy E | $121,400 | |
| Previous Owner | Burns Amy E | $25,000 | |
| Previous Owner | Burns Amy E | $121,600 | |
| Previous Owner | Burns Amy E | $84,800 |
Source: Public Records
Tax History Compared to Growth
Tax History
| Year | Tax Paid | Tax Assessment Tax Assessment Total Assessment is a certain percentage of the fair market value that is determined by local assessors to be the total taxable value of land and additions on the property. | Land | Improvement |
|---|---|---|---|---|
| 2025 | $4,736 | $468,900 | $200,800 | $268,100 |
| 2024 | $4,587 | $446,600 | $191,200 | $255,400 |
| 2023 | $4,322 | $413,600 | $177,100 | $236,500 |
| 2022 | $4,217 | $368,000 | $164,000 | $204,000 |
| 2021 | $3,916 | $333,600 | $164,000 | $169,600 |
| 2020 | $3,713 | $311,500 | $164,000 | $147,500 |
| 2019 | $3,653 | $301,400 | $157,700 | $143,700 |
| 2018 | $3,599 | $287,900 | $150,100 | $137,800 |
| 2017 | $3,514 | $274,300 | $143,000 | $131,300 |
| 2016 | $3,430 | $268,000 | $137,500 | $130,500 |
| 2015 | $3,305 | $256,200 | $137,500 | $118,700 |
| 2014 | $3,114 | $234,100 | $128,000 | $106,100 |
Source: Public Records
Map
Nearby Homes
- 54 Federal St
- 24 Blake Rd
- 33 Congress St
- 76 Kingman St
- 200 Justin Dr Unit 3
- 15 Summer St
- 116 Belmont St
- 16 Lindbergh Ave
- 23-25 Lindbergh Ave
- 501 Commerce Dr Unit 2310
- 501 Commerce Dr Unit 1111
- 501 Commerce Dr Unit 4206
- 501 Commerce Dr Unit 4308
- 501 Commerce Dr Unit 4306
- 19 Vine St Unit 3
- 19 Vine St Unit 1
- 114 Broad St Unit D
- 114 Broad St Unit C
- 11 Richmond St
- 122 Washington St Unit 22