Estimated Value: $297,091 - $325,000
3
Beds
2
Baths
1,675
Sq Ft
$187/Sq Ft
Est. Value
About This Home
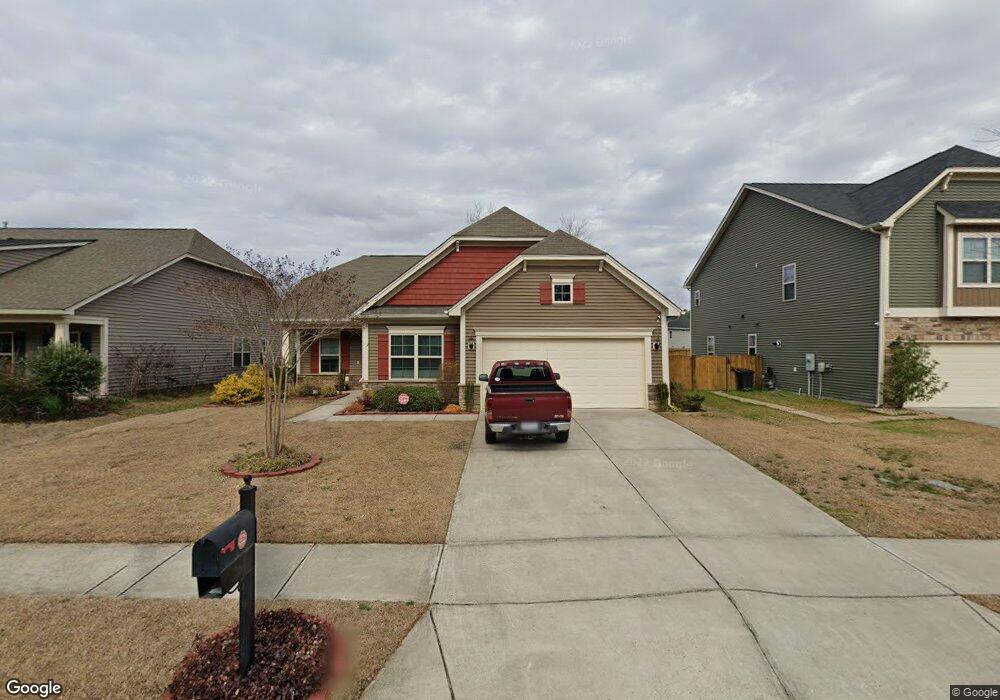
This home is located at 261 Tufton Ct, Cayce, SC 29033 and is currently estimated at $312,523, approximately $186 per square foot. 261 Tufton Ct is a home located in Lexington County with nearby schools including Cayce Elementary, Cyril B. Busbee Creative Arts Academy, and Brookland-Cayce High School.
Ownership History
Date
Name
Owned For
Owner Type
Purchase Details
Closed on
Jan 31, 2022
Sold by
Morgan Celestina S
Bought by
Purcell Morgan S
Current Estimated Value
Home Financials for this Owner
Home Financials are based on the most recent Mortgage that was taken out on this home.
Original Mortgage
$202,800
Outstanding Balance
$161,328
Interest Rate
2.62%
Mortgage Type
New Conventional
Estimated Equity
$151,195
Purchase Details
Closed on
Jan 12, 2016
Sold by
Sutton Floretta
Bought by
Mungo Homes Inc
Home Financials for this Owner
Home Financials are based on the most recent Mortgage that was taken out on this home.
Original Mortgage
$162,627
Interest Rate
3.96%
Mortgage Type
New Conventional
Purchase Details
Closed on
Jun 18, 2015
Sold by
South Capital Group Inc
Bought by
Mungo Homes Inc
Create a Home Valuation Report for This Property
The Home Valuation Report is an in-depth analysis detailing your home's value as well as a comparison with similar homes in the area
Home Values in the Area
Average Home Value in this Area
Purchase History
| Date | Buyer | Sale Price | Title Company |
|---|---|---|---|
| Purcell Morgan S | $253,500 | None Listed On Document | |
| Mungo Homes Inc | $171,187 | None Available | |
| Mungo Homes Inc | $170,000 | -- |
Source: Public Records
Mortgage History
| Date | Status | Borrower | Loan Amount |
|---|---|---|---|
| Open | Purcell Morgan S | $202,800 | |
| Previous Owner | Mungo Homes Inc | $162,627 |
Source: Public Records
Tax History
| Year | Tax Paid | Tax Assessment Tax Assessment Total Assessment is a certain percentage of the fair market value that is determined by local assessors to be the total taxable value of land and additions on the property. | Land | Improvement |
|---|---|---|---|---|
| 2024 | $1,760 | $10,140 | $1,400 | $8,740 |
| 2023 | $1,829 | $7,106 | $1,400 | $5,706 |
| 2022 | $1,267 | $7,106 | $1,400 | $5,706 |
| 2020 | $1,235 | $7,106 | $1,400 | $5,706 |
| 2019 | $1,215 | $6,847 | $1,400 | $5,447 |
| 2018 | $1,201 | $6,847 | $1,400 | $5,447 |
| 2017 | $1,159 | $6,847 | $1,400 | $5,447 |
| 2016 | $1,034 | $6,011 | $1,400 | $4,611 |
| 2014 | $110 | $378 | $378 | $0 |
| 2013 | -- | $2,100 | $2,100 | $0 |
Source: Public Records
Map
Nearby Homes
- 199 Rossmore Dr
- 135 Bonhill Dr
- 117 Bonhill Dr
- 111 Evergreen Ln
- 2533 Tiffany Trail
- 2529 Stonehenge Dr
- 834 Moss Creek Dr
- 2518 Stonehenge Dr
- 226 Tamwood Cir
- 722 Moss Creek Dr
- 1005 Sunnyside Dr
- 215 Tamwood Cir
- 723 Moss Creek Dr
- 207 Haynes Ln
- 1512 Summerland Dr
- 604 Moss Creek Dr
- 107 Cherry Ln
- 1137 Allen St
- 2402 Breezewood Rd
- 2314 Orchard St
Your Personal Tour Guide
Ask me questions while you tour the home.