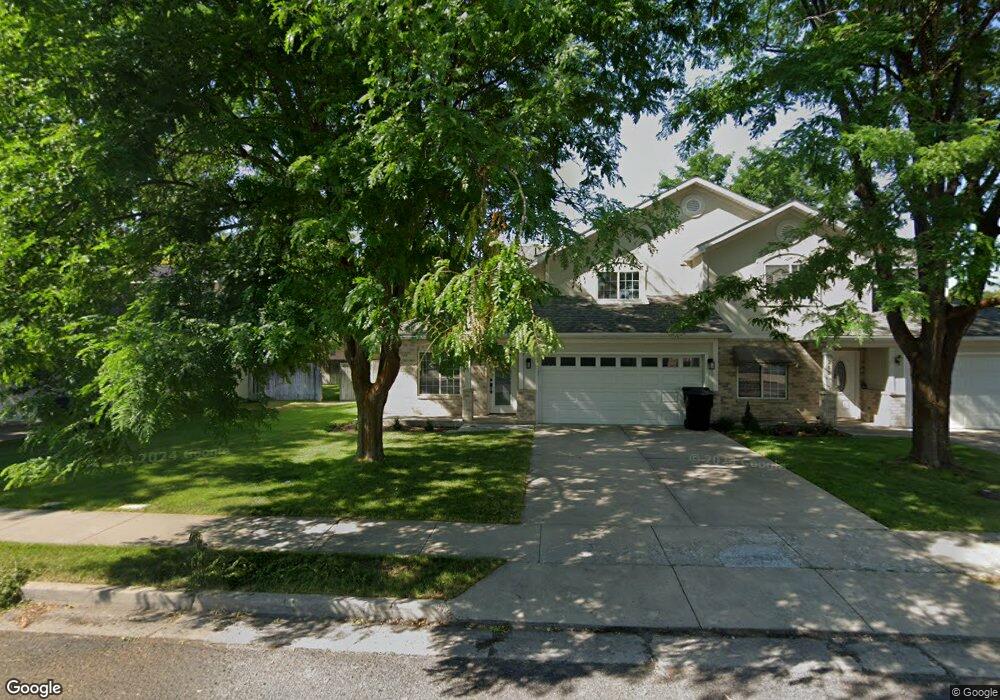
261 W 1140 N Logan, UT 84341
Bridger NeighborhoodEstimated Value: $336,000 - $387,143
3
Beds
2
Baths
1,600
Sq Ft
$219/Sq Ft
Est. Value
About This Home
This home is located at 261 W 1140 N, Logan, UT 84341 and is currently estimated at $351,036, approximately $219 per square foot. 261 W 1140 N is a home located in Cache County with nearby schools including Bridger School, Mount Logan Middle School, and Logan High School.
Ownership History
Date
Name
Owned For
Owner Type
Purchase Details
Closed on
Jan 9, 2017
Sold by
Porter Zane
Bought by
Porter Zane and Porter Emily
Current Estimated Value
Home Financials for this Owner
Home Financials are based on the most recent Mortgage that was taken out on this home.
Original Mortgage
$128,000
Outstanding Balance
$104,459
Interest Rate
3.87%
Mortgage Type
New Conventional
Estimated Equity
$246,577
Purchase Details
Closed on
Jan 6, 2017
Sold by
Rees Janice O
Bought by
Porter Zane
Home Financials for this Owner
Home Financials are based on the most recent Mortgage that was taken out on this home.
Original Mortgage
$128,000
Outstanding Balance
$104,459
Interest Rate
3.87%
Mortgage Type
New Conventional
Estimated Equity
$246,577
Purchase Details
Closed on
Jul 19, 2007
Sold by
Rees Janice
Bought by
Rees Dean R and Rees Janice O
Create a Home Valuation Report for This Property
The Home Valuation Report is an in-depth analysis detailing your home's value as well as a comparison with similar homes in the area
Home Values in the Area
Average Home Value in this Area
Purchase History
| Date | Buyer | Sale Price | Title Company |
|---|---|---|---|
| Porter Zane | -- | American Secure Title | |
| Porter Zane | -- | Advanced Title | |
| Rees Dean R | -- | Hickman Land Title Company |
Source: Public Records
Mortgage History
| Date | Status | Borrower | Loan Amount |
|---|---|---|---|
| Open | Porter Zane | $128,000 | |
| Closed | Porter Zane | $128,000 |
Source: Public Records
Tax History Compared to Growth
Tax History
| Year | Tax Paid | Tax Assessment Tax Assessment Total Assessment is a certain percentage of the fair market value that is determined by local assessors to be the total taxable value of land and additions on the property. | Land | Improvement |
|---|---|---|---|---|
| 2025 | $2,909 | $376,200 | $132,600 | $243,600 |
| 2024 | $300 | $376,200 | $132,600 | $243,600 |
| 2023 | $3,129 | $373,600 | $130,000 | $243,600 |
| 2022 | $2,884 | $321,600 | $78,000 | $243,600 |
| 2021 | $1,364 | $234,880 | $40,000 | $194,880 |
| 2020 | $1,319 | $204,450 | $40,000 | $164,450 |
| 2019 | $1,378 | $204,450 | $40,000 | $164,450 |
| 2018 | $1,351 | $183,000 | $40,000 | $143,000 |
| 2017 | $1,229 | $88,000 | $0 | $0 |
| 2016 | $1,274 | $80,575 | $0 | $0 |
| 2015 | $1,049 | $72,390 | $0 | $0 |
| 2014 | $949 | $72,390 | $0 | $0 |
| 2013 | -- | $72,390 | $0 | $0 |
Source: Public Records
Map
Nearby Homes
- 2200 N 220 W
- 1030 N 130 W Unit 100
- 897 N 250 W
- 894 N 400 W
- 873 N 480 W
- 559 W 1350 N Unit 41
- 430 W 810 N
- 420 W 750 N
- 1515 N 450 W Unit 103
- 514 W 1490 N Unit 102
- 223 W 730 N
- 243 W 730 N
- 539 W 1465 N Unit 17-102
- 190 W 700 N
- 20 Kings Ct
- 227 W 690 N
- 345 W 690 N
- 365 W 690 N
- 190 Kings Ct
- 1492 N 565 W Unit 101