Onyx Chelsea 261 W 28th St Unit 9C Floor 9 New York, NY 10001
Chelsea NeighborhoodEstimated payment $11,747/month
Highlights
- Rooftop Deck
- 3-minute walk to 28 Street (1,2 Line)
- Elevator
- P.S. 33 Chelsea Prep Rated A
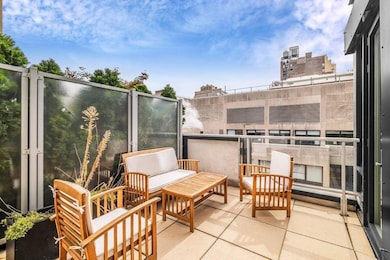
- Terrace
- 2-minute walk to Penn South Playground
About This Home
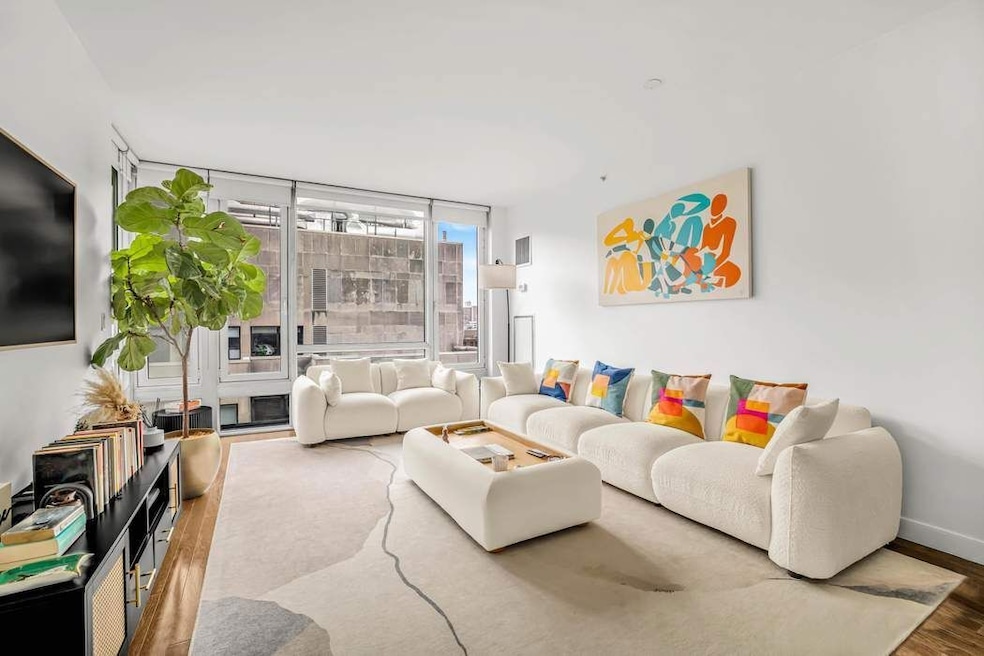
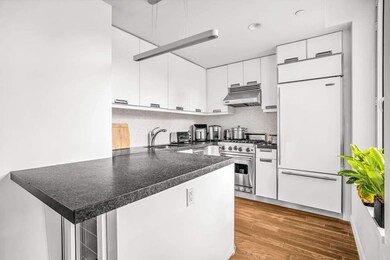
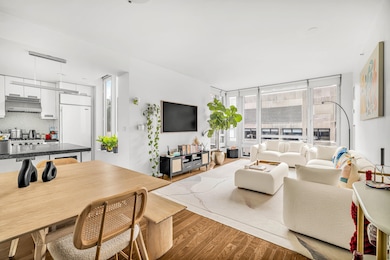
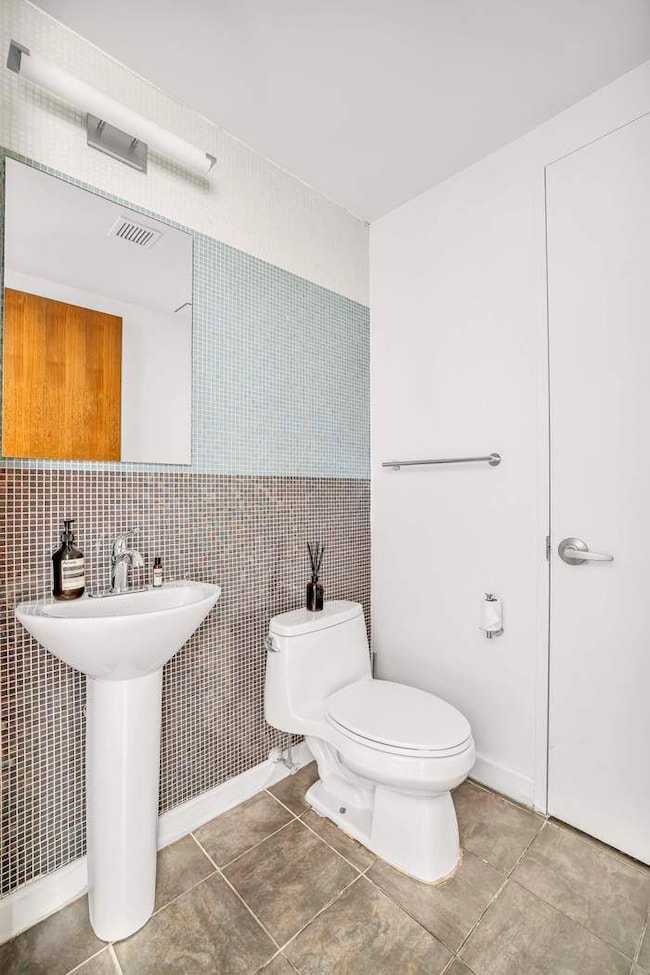
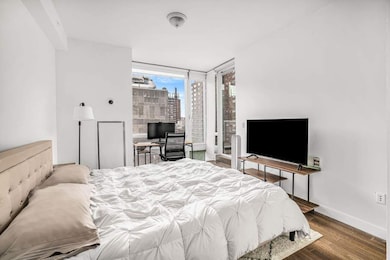
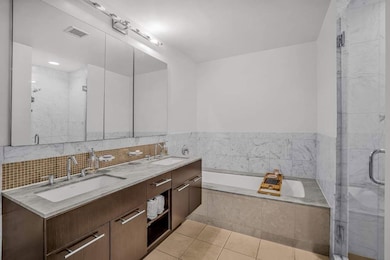
9C is a stunning one-bedroom, one-and-a-half-bathroom residence located in the Onyx Condominium, a full-service building in Chelsea. The living area is bathed in light with south facing exposures and floor to ceiling windows. A private, adjacent terrace extends your living space outdoors—ideal for morning coffee or evening cocktails. The windowed kitchen is equipped with top-of-the-line appliances including a Bosch dishwasher, Sub-Zero refrigerator, Viking stove and hood, and a built-in wine fridge. Thoughtful touches like a generous coat closet and powder room with tucked-away in-unit washer and dryer add everyday convenience. The bedroom is outfitted with its own private balcony and walk-in closet. The en-suite, spa-like five-fixture bathroom is sublime, featuring a soaking tub, stall shower, and double vanity. The apartment offers central air conditioning with thermostat control and hardwood flooring throughout. Residents of this elevator building enjoy amenities, including attentive 24/7 doorman, gym, and not one but two rooftop terraces offering city views. Situated in the lively neighborhood of Chelsea, a short distance from neighborhood highlights like High Line, Chelsea Market, Whitney Museum, Chelsea Piers. Located near subway and bus lines, providing easy access to the rest of the city.
Listing Agent
Sothebys International Realty License #10401205959 Listed on: 10/17/2025

Property Details
Home Type
- Condominium
Est. Annual Taxes
- $18,072
Year Built
- Built in 2006
HOA Fees
- $1,813 Monthly HOA Fees
Home Design
- 911 Sq Ft Home
- Entry on the 9th floor
Bedrooms and Bathrooms
- 1 Bedroom
Outdoor Features
- Balcony
- Terrace
Additional Features
- Dishwasher
- Laundry in unit
- South Facing Home
Listing and Financial Details
- Legal Lot and Block 7501 / 00778
Community Details
Overview
- 52 Units
- High-Rise Condominium
- Onyx Chelsea Condos
- Chelsea Subdivision
- 11-Story Property
Amenities
- Rooftop Deck
- Building Terrace
- Elevator
Map
About Onyx Chelsea
Home Values in the Area
Average Home Value in this Area
Tax History
| Year | Tax Paid | Tax Assessment Tax Assessment Total Assessment is a certain percentage of the fair market value that is determined by local assessors to be the total taxable value of land and additions on the property. | Land | Improvement |
|---|---|---|---|---|
| 2025 | $17,619 | $144,546 | $7,983 | $136,563 |
| 2024 | $17,619 | $140,926 | $7,983 | $132,943 |
| 2023 | $17,472 | $142,434 | $7,983 | $134,451 |
| 2022 | $17,487 | $149,901 | $7,983 | $141,918 |
| 2021 | $18,251 | $150,166 | $7,983 | $142,183 |
| 2020 | $17,744 | $166,332 | $7,983 | $158,349 |
| 2019 | $16,863 | $166,512 | $7,983 | $158,529 |
| 2018 | $15,324 | $156,656 | $7,983 | $148,673 |
| 2017 | $11,364 | $120,507 | $7,983 | $112,524 |
| 2016 | $11,104 | $117,539 | $7,983 | $109,556 |
| 2015 | $4,578 | $114,511 | $7,984 | $106,527 |
| 2014 | $4,578 | $107,824 | $7,984 | $99,840 |
Property History
| Date | Event | Price | List to Sale | Price per Sq Ft | Prior Sale |
|---|---|---|---|---|---|
| 10/17/2025 10/17/25 | For Sale | $1,599,000 | 0.0% | $1,755 / Sq Ft | |
| 04/14/2017 04/14/17 | Rented | -- | -- | -- | |
| 03/15/2017 03/15/17 | Under Contract | -- | -- | -- | |
| 10/05/2016 10/05/16 | For Rent | $5,300 | 0.0% | -- | |
| 08/18/2014 08/18/14 | Sold | $1,410,000 | -2.8% | $1,548 / Sq Ft | View Prior Sale |
| 07/19/2014 07/19/14 | Pending | -- | -- | -- | |
| 05/03/2014 05/03/14 | For Sale | $1,450,000 | -- | $1,592 / Sq Ft |
Purchase History
| Date | Type | Sale Price | Title Company |
|---|---|---|---|
| Deed | $1,410,000 | -- | |
| Deed | -- | -- | |
| Deed | $1,250,000 | -- |
Source: Real Estate Board of New York (REBNY)
MLS Number: RLS20055331
APN: 0778-1044
Disclaimer: Certain information contained herein is derived from information provided by parties other than Homes.com. All information provided is deemed reliable, but is not guaranteed to be accurate and should be independently verified.
![]() This information is not verified for authenticity or accuracy and is not guaranteed and may not reflect all real estate activity in the market. ©2025 The Real Estate Board of New York, Inc., All rights reserved.
This information is not verified for authenticity or accuracy and is not guaranteed and may not reflect all real estate activity in the market. ©2025 The Real Estate Board of New York, Inc., All rights reserved.
RLS Data display by Homes.com LLC
- 261 W 28th St Unit 6E
- 261 W 28th St Unit 6A
- 252 W 30th St Unit 12
- 300 W 30th St Unit 6 A
- 308 W 30th St Unit 10-F
- 215 W 28th St Unit 2C
- 215 W 28th St Unit 3F
- 215 W 28th St Unit 12A
- 215 W 28th St Unit 14C
- 215 W 28th St Unit 20B
- 215 W 28th St Unit 17C
- 215 W 28th St Unit 11A
- 408 8th Ave Unit 8B
- 261 W 25th St Unit 9B
- 261 W 25th St Unit 4D
- 261 W 25th St Unit 1D
- 261 W 25th St Unit GARDENC
- 315 7th Ave Unit 3C
- 315 7th Ave Unit 10E
- 315 7th Ave Unit 18D
- 261 W 28th St Unit 16-F
- 370 8th Ave Unit FL4-ID1039025P
- 244 W 29th St Unit FL17-ID2144
- 244 W 29th St Unit FL6-ID2141
- 244 W 29th St Unit FL15-ID2142
- 244 W 29th St Unit FL2-ID2149
- 393 8th Ave Unit ID1323927P
- 307 W 29th St Unit 3-C
- 309 W 29th St Unit 3-F
- 309 W 29th St Unit 2-R
- 300 W 30th St Unit 6A
- 300 W 30th St Unit 16C
- 313 W 29th St Unit A
- 313 W 29th St Unit F
- 308 W 30th St Unit 7E
- 335 8th Ave Unit 701
- 335 8th Ave Unit 726
- 335 8th Ave Unit 419
- 335 8th Ave Unit 724
- 335 8th Ave Unit 713