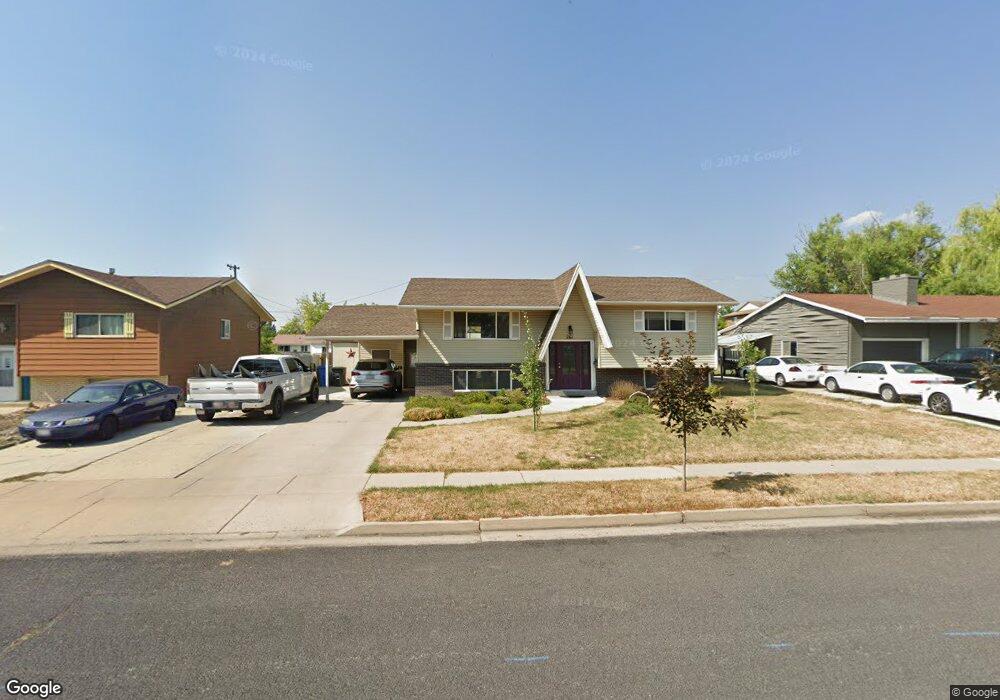
261 W 725 N Logan, UT 84321
Bridger NeighborhoodEstimated Value: $378,000 - $410,300
4
Beds
2
Baths
2,152
Sq Ft
$182/Sq Ft
Est. Value
About This Home
This home is located at 261 W 725 N, Logan, UT 84321 and is currently estimated at $392,075, approximately $182 per square foot. 261 W 725 N is a home located in Cache County with nearby schools including Bridger School, Mount Logan Middle School, and Logan High School.
Ownership History
Date
Name
Owned For
Owner Type
Purchase Details
Closed on
Jul 7, 2016
Sold by
Moeuy Rout J
Bought by
Lineback Steven and Lineback Christie
Current Estimated Value
Home Financials for this Owner
Home Financials are based on the most recent Mortgage that was taken out on this home.
Original Mortgage
$172,550
Outstanding Balance
$137,272
Interest Rate
3.64%
Mortgage Type
VA
Estimated Equity
$254,803
Purchase Details
Closed on
Nov 13, 2006
Sold by
Muoth Moeuy and Pring Sua
Bought by
Moeuy Rout J
Create a Home Valuation Report for This Property
The Home Valuation Report is an in-depth analysis detailing your home's value as well as a comparison with similar homes in the area
Home Values in the Area
Average Home Value in this Area
Purchase History
| Date | Buyer | Sale Price | Title Company |
|---|---|---|---|
| Lineback Steven | -- | Hickman Land Title Company | |
| Moeuy Rout J | -- | Cache Title Company |
Source: Public Records
Mortgage History
| Date | Status | Borrower | Loan Amount |
|---|---|---|---|
| Open | Lineback Steven | $172,550 |
Source: Public Records
Tax History Compared to Growth
Tax History
| Year | Tax Paid | Tax Assessment Tax Assessment Total Assessment is a certain percentage of the fair market value that is determined by local assessors to be the total taxable value of land and additions on the property. | Land | Improvement |
|---|---|---|---|---|
| 2025 | $1,712 | $221,470 | $0 | $0 |
| 2024 | $18 | $221,470 | $0 | $0 |
| 2023 | $1,845 | $220,260 | $0 | $0 |
| 2022 | $1,655 | $184,505 | $0 | $0 |
| 2021 | $1,558 | $268,440 | $45,000 | $223,440 |
| 2020 | $1,491 | $231,200 | $45,000 | $186,200 |
| 2019 | $1,462 | $216,808 | $45,000 | $171,808 |
| 2018 | $1,407 | $190,600 | $45,000 | $145,600 |
| 2017 | $1,306 | $93,500 | $0 | $0 |
| 2016 | $1,354 | $75,845 | $0 | $0 |
| 2015 | $1,099 | $75,845 | $0 | $0 |
| 2014 | $932 | $71,090 | $0 | $0 |
| 2013 | $60 | $71,090 | $0 | $0 |
Source: Public Records
Map
Nearby Homes