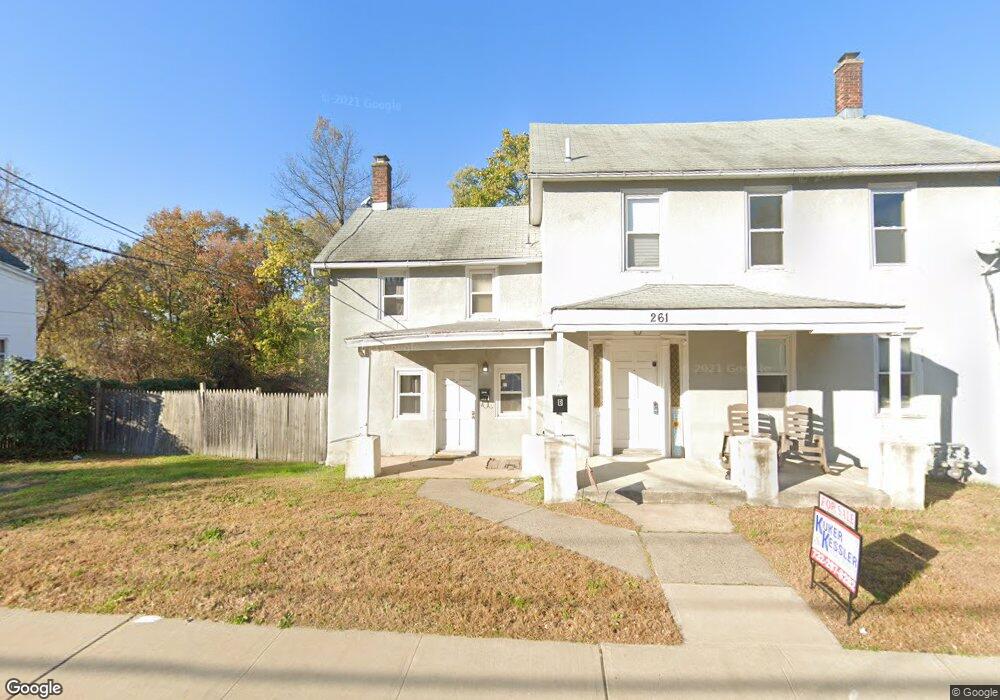
261 W Main St Unit c Bound Brook, NJ 08805
Estimated Value: $527,000 - $561,000
Studio
--
Bath
2,028
Sq Ft
$268/Sq Ft
Est. Value
About This Home
This home is located at 261 W Main St Unit c, Bound Brook, NJ 08805 and is currently estimated at $542,750, approximately $267 per square foot. 261 W Main St Unit c is a home located in Somerset County with nearby schools including LaMonte Annex Elementary School, Lafayette Elementary School, and Bound Brook High School.
Ownership History
Date
Name
Owned For
Owner Type
Purchase Details
Closed on
Jan 18, 2021
Sold by
Fugazzi Joseph
Bought by
Duran Christopher
Current Estimated Value
Home Financials for this Owner
Home Financials are based on the most recent Mortgage that was taken out on this home.
Original Mortgage
$343,295
Outstanding Balance
$305,796
Interest Rate
2.6%
Mortgage Type
Purchase Money Mortgage
Estimated Equity
$236,954
Purchase Details
Closed on
Oct 2, 2018
Sold by
Morelock Allan K and Morelock Allen K
Bought by
Fugazzi Joseph
Home Financials for this Owner
Home Financials are based on the most recent Mortgage that was taken out on this home.
Original Mortgage
$193,431
Interest Rate
4.8%
Mortgage Type
FHA
Purchase Details
Closed on
Sep 20, 2005
Sold by
Taylor Lonnie S
Bought by
Morelock Allen K
Home Financials for this Owner
Home Financials are based on the most recent Mortgage that was taken out on this home.
Original Mortgage
$192,000
Interest Rate
5.81%
Create a Home Valuation Report for This Property
The Home Valuation Report is an in-depth analysis detailing your home's value as well as a comparison with similar homes in the area
Home Values in the Area
Average Home Value in this Area
Purchase History
| Date | Buyer | Sale Price | Title Company |
|---|---|---|---|
| Duran Christopher | $325,000 | Foundation Ttl Llc East Brun | |
| Fugazzi Joseph | $197,000 | Multiple | |
| Morelock Allen K | $240,000 | -- |
Source: Public Records
Mortgage History
| Date | Status | Borrower | Loan Amount |
|---|---|---|---|
| Open | Duran Christopher | $343,295 | |
| Previous Owner | Fugazzi Joseph | $193,431 | |
| Previous Owner | Morelock Allen K | $192,000 |
Source: Public Records
Tax History
| Year | Tax Paid | Tax Assessment Tax Assessment Total Assessment is a certain percentage of the fair market value that is determined by local assessors to be the total taxable value of land and additions on the property. | Land | Improvement |
|---|---|---|---|---|
| 2025 | $8,699 | $429,700 | $143,700 | $286,000 |
| 2024 | $8,699 | $383,400 | $126,700 | $256,700 |
| 2023 | $8,498 | $360,400 | $109,700 | $250,700 |
| 2022 | $8,243 | $331,300 | $92,700 | $238,600 |
| 2021 | $9,117 | $324,000 | $75,700 | $248,300 |
| 2020 | $6,705 | $217,200 | $58,700 | $158,500 |
| 2019 | $6,480 | $200,200 | $41,700 | $158,500 |
| 2018 | $6,541 | $196,200 | $33,200 | $163,000 |
| 2017 | $6,607 | $193,700 | $33,200 | $160,500 |
| 2016 | $6,444 | $190,300 | $11,900 | $178,400 |
| 2015 | $6,360 | $192,100 | $11,900 | $180,200 |
| 2014 | $7,374 | $215,100 | $34,900 | $180,200 |
Source: Public Records
Map
Nearby Homes
- 432 Talmage Ave
- 26 Louis Ave
- 126 W High St
- 20 van Syckle Blvd
- 17 Talmage Ave
- 120B Little Place
- 514 Longwood Ave
- 306 Church St
- 328 John St
- 520 Winsor St
- 561 Marion St
- 112 East St
- 123 Edgewood Terrace
- 428 Helfin St
- 408 E Union Ave
- 617 Vosseller Ave
- 315 East St
- 105 Swing Bridge Ln Unit 1009
- 8 Swing Bridge Ln Unit 904
- 535 Madison Ave
- 261 W Main St Unit A
- 261 W Main St
- 253 W Main St Unit 255
- 265-267 W Main St
- 265 W Main St Unit 267
- 247 W Main St
- 271 W Main St
- 258 W Main St
- 266 W Main St
- 254 W Main St
- 273 W Main St
- 250 W Main St
- 270 W Main St
- 245 W Main St
- 272 W Main St
- 239 W Main St
- 280 W Main St
- 281 W Main St
- 240 W Main St
- 282 W Main St
Your Personal Tour Guide
Ask me questions while you tour the home.